ModsCode / Gallery / Designs / Scatter plot
Scatter plot
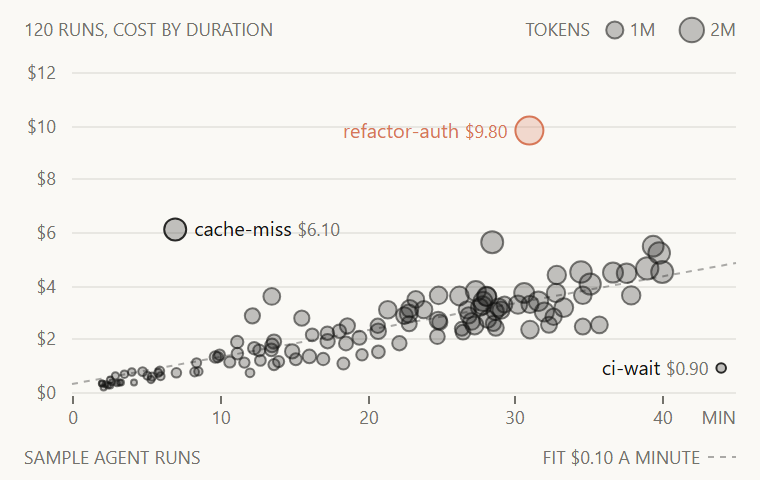
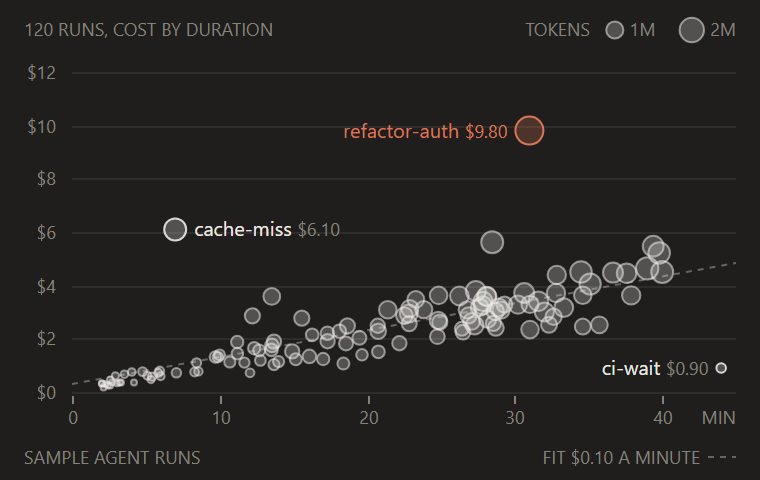
Agent runs by duration and cost, bubble area for tokens, with a dashed least-squares fit and the three runs furthest from it named.
hooks/designs/scatter.mjs
// scatter: 120 agent runs by how long they took and what they cost, in candle's look; the bubble's area
// is the run's tokens. 117 runs follow one habit: about 38K tokens a minute (log sigma 0.2) at a
// blended $3.10 per million tokens (log sigma 0.12), so cost tracks time. Three runs break it on
// purpose, the kind worth a second look: refactor-auth (31 min, 2.6M tokens, $9.80), cache-miss (7 min,
// 1.6M, $6.10) and ci-wait (44 min idle on CI, 0.3M, $0.90). The dashed line is an ordinary
// least-squares fit of cost on minutes at candle's 35% reference weight; its slope is keyed in the
// caption row, since the line runs through the thick of the runs.
// The three runs furthest from that line (largest absolute residual) are labelled, chosen by code, not
// by name; the most expensive of them is the one Claude orange. Bubbles are 25% ink area fills with a 55% ink
// rim so overlaps stay countable, radius by the square root of tokens so area reads true. Every number
// in the picture is computed in draw(); with this seed the fit lands on $0.30 + $0.10 a minute. Normal
// draws use the Box-Muller transform (Box and Muller, 1958). Sample data only.
const W = 380
const H = 240
const STAGE = '#FAF9F5'
const INK = '#141413'
const MUTED = '#73726C'
const CLAUDE = '#D77757'
const FONT = "'Inter Tight','Segoe UI',system-ui,sans-serif"
const PLOT = { left: 36, right: 368, top: 36, bottom: 196 }
const RUNS = 120
const R_MAX = 7 // the radius of the largest run's bubble
const f = n => n.toFixed(1)

// The three runs that break the habit, with the name a person would know them by
const ODD = [
  { name: 'refactor-auth', min: 31, tok: 2.6e6, cost: 9.8 },
  { name: 'cache-miss', min: 7, tok: 1.6e6, cost: 6.1 },
  { name: 'ci-wait', min: 44, tok: 0.3e6, cost: 0.9 },
]

// A seeded walk, so the picture is the same on every render
function rng(seed) {
  return () => (seed = (Math.imul(seed, 1103515245) + 12345) & 0x7fffffff) / 0x7fffffff
}

const text = (x, y, s, { size = 9, fill = MUTED, anchor = 'start' } = {}) =>
  `<text x="${f(x)}" y="${f(y)}"${anchor === 'start' ? '' : ` text-anchor="${anchor}"`} font-size="${size}" font-family="${FONT}" fill="${fill}">${s}</text>`
const millions = t => `${t >= 1e6 ? (t / 1e6).toFixed(t % 1e6 ? 1 : 0) : (t / 1e6).toFixed(1)}M`

// Short runs are commoner than long ones (the power skews minutes toward 2)
function sample() {
  const rnd = rng(20261038)
  const normal = () => Math.sqrt(-2 * Math.log(1 - rnd())) * Math.cos(2 * Math.PI * rnd())
  const runs = []
  for (let i = 0; i < RUNS - ODD.length; i++) {
    const min = 2 + 38 * Math.pow(rnd(), 1.3)
    const tok = min * 38000 * Math.exp(0.2 * normal())
    runs.push({ min, tok, cost: (tok / 1e6) * 3.1 * Math.exp(0.12 * normal()) })
  }
  return runs.concat(ODD)
}

function draw() {
  const runs = sample()
  const n = runs.length
  const mx = runs.reduce((s, r) => s + r.min, 0) / n
  const my = runs.reduce((s, r) => s + r.cost, 0) / n
  const slope = runs.reduce((s, r) => s + (r.min - mx) * (r.cost - my), 0) / runs.reduce((s, r) => s + (r.min - mx) ** 2, 0)
  const cut = my - slope * mx
  const xEnd = Math.ceil((Math.max(...runs.map(r => r.min)) * 1.02) / 5) * 5 // whole 5 minutes past the longest run
  const yEnd = Math.ceil((Math.max(...runs.map(r => r.cost)) * 1.1) / 2) * 2
  const tMax = Math.max(...runs.map(r => r.tok))
  const x = m => PLOT.left + ((PLOT.right - PLOT.left) * m) / xEnd
  const y = c => PLOT.bottom - ((PLOT.bottom - PLOT.top) * c) / yEnd
  const rad = t => Math.max(1.5, R_MAX * Math.sqrt(t / tMax))
  const parts = [`<rect width="${W}" height="${H}" rx="4" fill="${STAGE}"/>`]

  // Cost grid: hairlines every $2, labelled on the left; minute ticks as 4px stubs below
  for (let c = 0; c <= yEnd; c += 2) {
    const gy = Math.round(y(c)) + 0.5
    parts.push(`<line x1="${PLOT.left}" x2="${PLOT.right}" y1="${f(gy)}" y2="${f(gy)}" stroke="${INK}" stroke-opacity="0.08" stroke-width="1"/>`)
    parts.push(text(28, gy + 3, `$${c}`, { anchor: 'end' }))
  }
  for (let m = 0; m <= xEnd; m += 10) {
    const tx = Math.round(x(m)) + 0.5
    parts.push(`<line x1="${f(tx)}" x2="${f(tx)}" y1="${PLOT.bottom + 2}" y2="${PLOT.bottom + 6}" stroke="${MUTED}" stroke-width="1"/>`)
    if (m < xEnd) parts.push(text(tx, PLOT.bottom + 16, String(m), { anchor: 'middle' }))
  }
  parts.push(text(W - 12, PLOT.bottom + 16, 'MIN', { anchor: 'end' }))

  // Header: the size key on the right, read as the area of two bubbles
  parts.push(text(12, 18, `${n} RUNS, COST BY DURATION`))
  const keys = [1e6, 2e6].filter(t => t <= tMax)
  let kx = W - 12
  const key = []
  for (const t of keys.reverse()) {
    const label = millions(t)
    key.unshift(text(kx, 18, label, { anchor: 'end' }))
    kx -= label.length * 6 + 4 + rad(t) // M runs wide, so 6px a character
    key.unshift(`<circle cx="${f(kx)}" cy="15" r="${f(rad(t))}" fill="${INK}" fill-opacity="0.25" stroke="${INK}" stroke-opacity="0.55" stroke-width="1"/>`)
    kx -= rad(t) + 12
  }
  parts.push(text(kx + 4, 18, 'TOKENS', { anchor: 'end' }), ...key)

  // The fit runs across the whole plot, cut where it leaves the cost range
  const x1 = Math.max(0, cut < 0 ? -cut / slope : 0)
  const x2 = Math.min(xEnd, (yEnd - cut) / slope)
  parts.push(`<line x1="${f(x(x1))}" x2="${f(x(x2))}" y1="${f(y(cut + slope * x1))}" y2="${f(y(cut + slope * x2))}" stroke="${INK}" stroke-opacity="0.35" stroke-width="1" stroke-dasharray="3 3"/>`)

  // Largest bubbles first, so a small run stays visible on top of a big one
  const res = r => r.cost - (cut + slope * r.min)
  const odd = [...runs].sort((a, b) => Math.abs(res(b)) - Math.abs(res(a))).slice(0, 3)
  const top = odd.reduce((a, b) => (b.cost > a.cost ? b : a))
  for (const r of [...runs].sort((a, b) => b.tok - a.tok)) {
    const c = r === top ? CLAUDE : INK
    const rim = r === top ? 1 : odd.includes(r) ? 0.9 : 0.55
    parts.push(`<circle cx="${f(x(r.min))}" cy="${f(y(r.cost))}" r="${f(rad(r.tok))}" fill="${c}" fill-opacity="0.25" stroke="${c}" stroke-opacity="${rim}" stroke-width="1"/>`)
  }

  // Labels: name in ink (Claude orange for the top run) and cost in muted, to the right of the bubble when it
  // fits inside W - 12, else to the left
  for (const r of odd) {
    const cx = x(r.min)
    const cy = y(r.cost)
    const gap = rad(r.tok) + 4
    const cost = `$${r.cost.toFixed(2)}`
    const wide = (r.name.length * 5.6 + 4 + cost.length * 5) * 1.1
    const right = cx + gap + wide <= W - 12
    const fill = r === top ? CLAUDE : INK
    parts.push(`<text x="${f(right ? cx + gap : cx - gap)}" y="${f(cy + 3.5)}"${right ? '' : ' text-anchor="end"'} font-size="10" font-family="${FONT}" fill="${fill}">${r.name} <tspan font-size="9" fill="${r === top ? CLAUDE : MUTED}">${cost}</tspan></text>`)
  }

  // The slope is keyed in the caption row with a sample of the dashed line: the line runs through the
  // thick of the runs, so a label on it would sit on bubbles
  const fit = `FIT $${slope.toFixed(2)} A MINUTE`
  const lx = W - 12 - 14 // the sample sits after the words, so their width never has to be guessed
  parts.push(`<line x1="${f(lx)}" x2="${f(lx + 14)}" y1="${H - 11.5}" y2="${H - 11.5}" stroke="${INK}" stroke-opacity="0.35" stroke-width="1" stroke-dasharray="3 3"/>`)
  parts.push(text(lx - 4, H - 8, fit, { anchor: 'end' }))

  parts.push(text(12, H - 8, 'SAMPLE AGENT RUNS'))
  return `<svg xmlns="http://www.w3.org/2000/svg" viewBox="0 0 ${W} ${H}" width="${W}" height="${H}">${parts.join('')}</svg>`
}

let source // drawn on first use and kept: the pane loads every design, so none pays at load time
export default {
  id: 'scatter',
  title: 'Scatter plot',
  category: 'spread',
  description: 'Agent runs by duration and cost, bubble area for tokens, with a dashed least-squares fit and the three runs furthest from it named.',
  element: ui => ui.Svg({ source: (source ??= draw()), alt: `Scatter plot of ${RUNS} agent runs by duration and cost with bubble size for tokens, a fit line and three outliers named, sample data`, width: W, height: H }),
}
To use it in a mod: copy the file to your mod's hooks/designs/ and return its element(ui) from a pane's ui.render. How a pane is built.
Code: PolyForm Noncommercial License 1.0.0: noncommercial use only. Required Notice: Copyright 2026 Haruki Nakada (https://modscode.com).