ModsCode / Gallery / Designs / Ridgeline plot
Ridgeline plot
Latency density for each of the last seven days as overlapping rows on one scale, the median marked on each row and today in front in Claude orange.
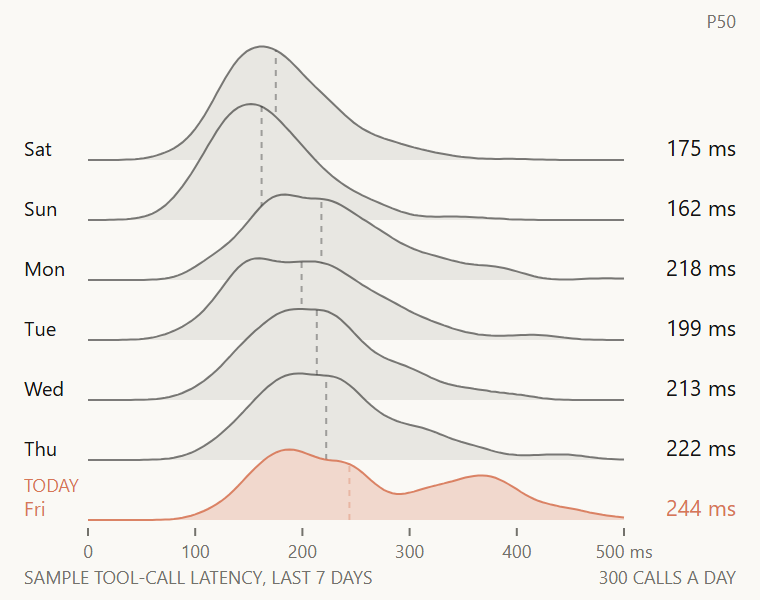
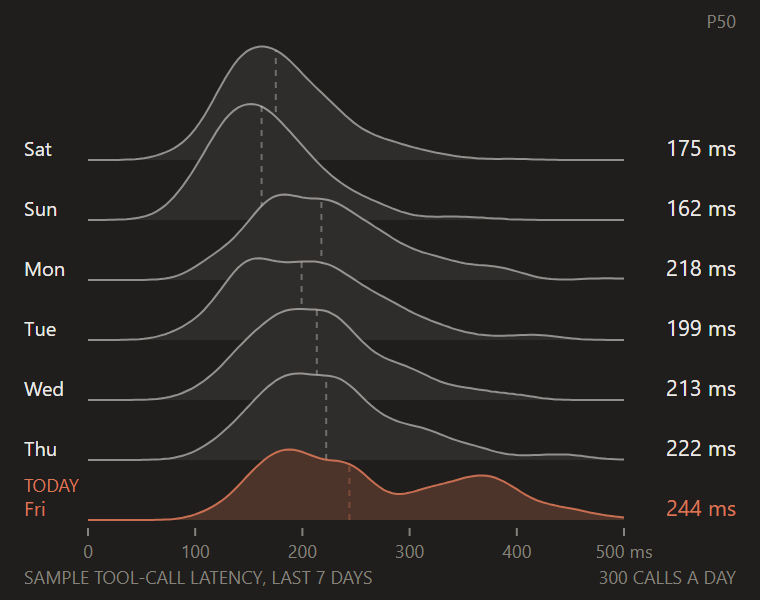
hooks/designs/ridgeline.mjs
// ridgeline: tool-call latency for each of the last seven days (Sat 2026-10-03 to Fri 2026-10-09,
// today) as seven overlapping density rows in candle's look, oldest at the back and today in front, so
// no row hides the day to notice. Each row is a Gaussian kernel density estimate with an 18ms
// bandwidth, evaluated every 4ms from 0 to 500ms; all rows share one height scale, so a narrow day
// stands taller. A row is painted with the stage colour first and then ink under a 1px outline, so the
// row in front hides the one behind instead of muddying it. The ordinary days take the faint-area rung
// (0.08), not the 0.25 area fill: six hills at 0.25 make the heaviest grey on the sheet, and the
// outline already carries the shape; today alone keeps 0.25 in Claude orange. Rows overlap by about half their
// peak (30px pitch, 58px peak). The sample is seeded (20261031): 300 log-normal calls a day with a
// spread of 0.3, medians near 200ms on weekdays and 165ms at the weekend; Friday, today and the only
// Claude orange row, sends 30% of its calls to a second hump at 380ms with a spread of 0.1 (a slow upstream),
// which lifts its median. The p50 of each day is written at the right edge. The KDE is the textbook
// estimator, hand-written here. Sample data only.
const W = 380
const H = 300
const STAGE = '#FAF9F5'
const INK = '#141413'
const MUTED = '#73726C'
const CLAUDE = '#D77757'
const FONT = "'Inter Tight','Segoe UI',system-ui,sans-serif"
const PLOT = { left: 44, right: 312 }
const MAX_MS = 500
const STEP_MS = 4
const BW = 18 // kernel bandwidth in ms
const B0 = 80 // baseline of the first row
const PITCH = 30
const PEAK = 58 // the tallest density in the week reaches this many px above its baseline
// median ms, and an optional slow hump: share of calls and its median
const DAYS = [
  { name: 'Sat', median: 168 },
  { name: 'Sun', median: 160 },
  { name: 'Mon', median: 212 },
  { name: 'Tue', median: 198 },
  { name: 'Wed', median: 205 },
  { name: 'Thu', median: 221 },
  { name: 'Fri', median: 214, slow: { share: 0.3, median: 380 }, today: true },
]
const f = n => n.toFixed(1)

function rng(seed) {
  return () => (seed = (Math.imul(seed, 1103515245) + 12345) & 0x7fffffff) / 0x7fffffff
}

const text = (x, y, s, { size = 9, fill = MUTED, anchor = 'start', font = FONT } = {}) =>
  `<text x="${f(x)}" y="${f(y)}"${anchor === 'start' ? '' : ` text-anchor="${anchor}"`} font-size="${size}" font-family="${font}" fill="${fill}">${s}</text>`

// Seeded calls in ms: log-normal around each day's median, a share from the slow hump on Friday
function sample() {
  const rnd = rng(20261031)
  const normal = () => Math.sqrt(-2 * Math.log(1 - rnd())) * Math.cos(2 * Math.PI * rnd())
  return DAYS.map(day => {
    const calls = []
    for (let i = 0; i < 300; i++) {
      const slow = day.slow && rnd() < day.slow.share
      const m = slow ? day.slow.median : day.median
      calls.push(m * Math.exp((slow ? 0.1 : 0.3) * normal()))
    }
    return calls.sort((a, b) => a - b)
  })
}

const kde = calls => {
  const k = 1 / (calls.length * BW * Math.sqrt(2 * Math.PI))
  const out = []
  for (let t = 0; t <= MAX_MS; t += STEP_MS) {
    let s = 0
    for (const c of calls) s += Math.exp(-0.5 * ((t - c) / BW) ** 2)
    out.push(s * k)
  }
  return out
}

function draw() {
  const week = sample()
  const dens = week.map(kde)
  const top = Math.max(...dens.flat())
  const x = t => PLOT.left + ((PLOT.right - PLOT.left) * t) / MAX_MS
  const parts = [`<rect width="${W}" height="${H}" rx="4" fill="${STAGE}"/>`]
  parts.push(text(W - 12, 14, 'P50', { anchor: 'end' }))

  // Back to front: the first row sits highest and is drawn first
  DAYS.forEach((day, r) => {
    const base = B0 + r * PITCH
    const y = d => base - (d / top) * PEAK
    const pts = dens[r].map((d, i) => `${f(x(i * STEP_MS))} ${f(y(d))}`)
    const line = `M${pts.join('L')}`
    const closed = `${line}L${f(x(MAX_MS))} ${base}L${f(x(0))} ${base}Z`
    const tone = day.today ? CLAUDE : INK
    parts.push(`<path d="${closed}" fill="${STAGE}"/>`)
    parts.push(`<path d="${closed}" fill="${tone}" fill-opacity="${day.today ? 0.25 : 0.08}"/>`)
    parts.push(`<path d="${line}" fill="none" stroke="${tone}" stroke-opacity="${day.today ? 0.9 : 0.55}" stroke-width="1"/>`)
    // The median: a 1px stem from the baseline up to the curve
    const calls = week[r]
    const p50 = (calls[149] + calls[150]) / 2
    const i = Math.round(p50 / STEP_MS)
    parts.push(`<line x1="${f(x(p50))}" x2="${f(x(p50))}" y1="${base}" y2="${f(y(dens[r][i]))}" stroke="${tone}" stroke-opacity="0.35" stroke-dasharray="3 3"/>`)
    parts.push(text(12, base - 2, day.name, { size: 10, fill: day.today ? CLAUDE : INK }))
    if (day.today) parts.push(text(12, base - 14, 'TODAY', { fill: CLAUDE }))
    parts.push(text(W - 12, base - 2, `${Math.round(p50)} ms`, { size: 11, fill: day.today ? CLAUDE : INK, anchor: 'end' }))
  })

  const axis = B0 + (DAYS.length - 1) * PITCH
  for (let t = 0; t <= MAX_MS; t += 100) {
    parts.push(`<line x1="${f(x(t))}" x2="${f(x(t))}" y1="${axis + 4}" y2="${axis + 8}" stroke="${MUTED}" stroke-width="1"/>`)
    parts.push(text(x(t), axis + 19, t === MAX_MS ? `${t} ms` : String(t), { anchor: 'middle' }))
  }
  parts.push(text(12, H - 8, 'SAMPLE TOOL-CALL LATENCY, LAST 7 DAYS'))
  parts.push(text(W - 12, H - 8, '300 CALLS A DAY', { anchor: 'end' }))
  return `<svg xmlns="http://www.w3.org/2000/svg" viewBox="0 0 ${W} ${H}" width="${W}" height="${H}">${parts.join('')}</svg>`
}

let source // drawn on first use and kept: the pane loads every design, so none pays at load time
export default {
  id: 'ridgeline',
  title: 'Ridgeline plot',
  category: 'spread',
  description: 'Latency density for each of the last seven days as overlapping rows on one scale, the median marked on each row and today in front in Claude orange.',
  element: ui => ui.Svg({ source: (source ??= draw()), alt: 'Ridgeline plot of tool-call latency for the last seven days, today in front in Claude orange with a slow second hump, sample data', width: W, height: H }),
}
To use it in a mod: copy the file to your mod's hooks/designs/ and return its element(ui) from a pane's ui.render. How a pane is built.
Code: PolyForm Noncommercial License 1.0.0: noncommercial use only. Required Notice: Copyright 2026 Haruki Nakada (https://modscode.com).