ModsCode / Gallery / Designs / Violin plot
Violin plot
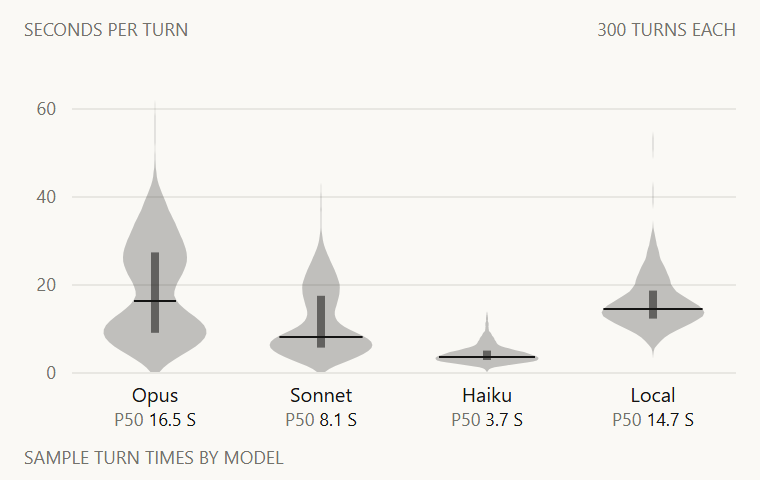
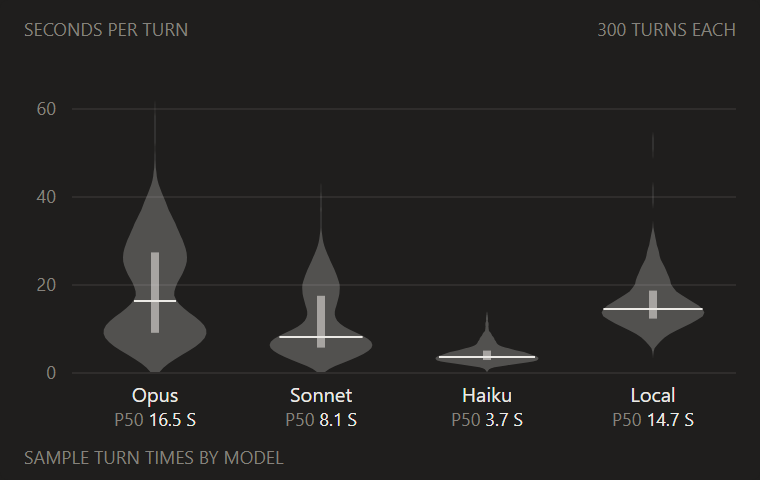
Seconds per turn for four models as mirrored density shapes, with an interquartile bar and a median line; two of the shapes have two bulges.
hooks/designs/violin.mjs
// violin: seconds per turn for four models, 300 turns each, in candle's look. Opus and Sonnet are
// mixtures of two log-normals, quick replies (median 9 s and 6 s) and tool-heavy turns (28 s and 19 s),
// so their shapes have two bulges: the thing a violin shows and a box plot hides. Haiku (3.5 s) and a
// local model (15 s) are single log-normals. Each shape is a kernel density estimate with the
// Epanechnikov kernel, 0.75 (1 - u^2), at Silverman's rule-of-thumb bandwidth (0.9 min(sd, IQR/1.34)
// n^-1/5) times 2.214, the factor that carries a Gaussian bandwidth over to this kernel (Marron and
// Nolan's canonical bandwidths). It is evaluated at 64 steps from one bandwidth below each model's
// fastest turn (never under 0 s) to one above its slowest, where this kernel reaches exactly zero, so
// every shape closes to a point, and mirrored as one path at 25% ink. Every shape is scaled
// to the same widest point, 62% of its slot (candle's bar share), since the models' spreads differ
// too much for one density scale. The interquartile range is a 4px bar at 55% ink and the median a
// 1px full-ink line across the shape, with the median printed under the name. Every number is
// computed in draw(); with this seed the medians land on 16.5, 8.1, 3.7 and 14.7 s. Normal draws use
// the Box-Muller transform (Box and Muller, 1958); quartiles interpolate linearly between order
// statistics, the rule of d3-array's quantile (ISC), written out here. Sample data only.
const W = 380
const H = 240
const STAGE = '#FAF9F5'
const INK = '#141413'
const MUTED = '#73726C'
const FONT = "'Inter Tight','Segoe UI',system-ui,sans-serif"
const PLOT = { left: 36, right: 368, top: 32, bottom: 186 }
const TURNS = 300
const STEPS = 64
const f = n => n.toFixed(1)

// Each model is a mixture of log-normals: [weight, median seconds, log sigma]
const MODELS = [
  ['Opus', [[0.55, 9, 0.35], [0.45, 28, 0.22]]],
  ['Sonnet', [[0.65, 6, 0.35], [0.35, 19, 0.25]]],
  ['Haiku', [[1, 3.5, 0.45]]],
  ['Local', [[1, 15, 0.33]]],
]

// A seeded walk, so the picture is the same on every render
function rng(seed) {
  return () => (seed = (Math.imul(seed, 1103515245) + 12345) & 0x7fffffff) / 0x7fffffff
}

const text = (x, y, s, { size = 9, fill = MUTED, anchor = 'start' } = {}) =>
  `<text x="${f(x)}" y="${f(y)}"${anchor === 'start' ? '' : ` text-anchor="${anchor}"`} font-size="${size}" font-family="${FONT}" fill="${fill}">${s}</text>`
const quantile = (sorted, p) => {
  const i = (sorted.length - 1) * p
  const lo = Math.floor(i)
  return sorted[lo] + (sorted[Math.min(lo + 1, sorted.length - 1)] - sorted[lo]) * (i - lo)
}

function sample() {
  const rnd = rng(20261039)
  const normal = () => Math.sqrt(-2 * Math.log(1 - rnd())) * Math.cos(2 * Math.PI * rnd())
  return MODELS.map(([name, mix]) => {
    const s = []
    for (let i = 0; i < TURNS; i++) {
      let u = rnd()
      let k = 0
      while (k < mix.length - 1 && u > mix[k][0]) u -= mix[k++][0]
      s.push(mix[k][1] * Math.exp(mix[k][2] * normal()))
    }
    return { name, s: s.sort((a, b) => a - b) }
  })
}

// Density at STEPS points from one bandwidth below the fastest turn (never under 0 s) to one above the
// slowest: the kernel is exactly zero past one bandwidth, so the shape closes to a point, not a flat cut
function density(s) {
  const n = s.length
  const mean = s.reduce((a, v) => a + v, 0) / n
  const sd = Math.sqrt(s.reduce((a, v) => a + (v - mean) ** 2, 0) / (n - 1))
  const iqr = quantile(s, 0.75) - quantile(s, 0.25)
  const h = 2.214 * 0.9 * Math.min(sd, iqr / 1.34) * n ** -0.2
  const lo = Math.max(0, s[0] - h)
  const hi = s[n - 1] + h
  const pts = Array.from({ length: STEPS + 1 }, (_, i) => {
    const t = lo + ((hi - lo) * i) / STEPS
    let d = 0
    for (const v of s) {
      const u = (t - v) / h
      if (u > -1 && u < 1) d += 0.75 * (1 - u * u)
    }
    return [t, d / (n * h)]
  })
  return { pts, lo, hi }
}

function draw() {
  const models = sample()
  const top = Math.ceil(Math.max(...models.map(m => density(m.s).hi)) / 10) * 10 // a whole 10 s past the highest shape
  const y = v => PLOT.bottom - ((PLOT.bottom - PLOT.top) * v) / top
  const slot = (PLOT.right - PLOT.left) / models.length
  const half = (slot * 0.62) / 2
  const parts = [`<rect width="${W}" height="${H}" rx="4" fill="${STAGE}"/>`]

  parts.push(text(12, 18, 'SECONDS PER TURN'))
  parts.push(text(W - 12, 18, `${TURNS} TURNS EACH`, { anchor: 'end' }))
  for (let v = 0; v <= top; v += 20) {
    const gy = Math.round(y(v)) + 0.5
    parts.push(`<line x1="${PLOT.left}" x2="${PLOT.right}" y1="${f(gy)}" y2="${f(gy)}" stroke="${INK}" stroke-opacity="0.08" stroke-width="1"/>`)
    parts.push(text(28, gy + 3, String(v), { anchor: 'end' }))
  }

  models.forEach((m, i) => {
    const cx = PLOT.left + slot * (i + 0.5)
    const { pts: dens, lo, hi } = density(m.s)
    const dmax = Math.max(...dens.map(d => d[1]))
    const w = d => (half * d) / dmax
    const right = dens.map(([t, d]) => `${f(cx + w(d))} ${f(y(t))}`)
    const left = dens.map(([t, d]) => `${f(cx - w(d))} ${f(y(t))}`).reverse()
    parts.push(`<path d="M${right.join('L')}L${left.join('L')}Z" fill="${INK}" fill-opacity="0.25"/>`)

    const q1 = quantile(m.s, 0.25)
    const q2 = quantile(m.s, 0.5)
    const q3 = quantile(m.s, 0.75)
    parts.push(`<rect x="${f(cx - 2)}" y="${f(y(q3))}" width="4" height="${f(y(q1) - y(q3))}" fill="${INK}" fill-opacity="0.55"/>`)
    // The median line spans the shape's width at the median, read off the nearest density step
    const step = Math.round(((q2 - lo) / (hi - lo)) * STEPS)
    const mw = Math.max(4, w(dens[step][1]))
    const my = Math.round(y(q2)) + 0.5
    parts.push(`<line x1="${f(cx - mw)}" x2="${f(cx + mw)}" y1="${f(my)}" y2="${f(my)}" stroke="${INK}" stroke-width="1"/>`)

    parts.push(text(cx, PLOT.bottom + 15, m.name, { size: 10, fill: INK, anchor: 'middle' }))
    parts.push(`<text x="${f(cx)}" y="${PLOT.bottom + 27}" text-anchor="middle" font-size="9" font-family="${FONT}" fill="${MUTED}">P50 <tspan fill="${INK}">${q2.toFixed(1)} S</tspan></text>`)
  })

  parts.push(text(12, H - 8, 'SAMPLE TURN TIMES BY MODEL'))
  return `<svg xmlns="http://www.w3.org/2000/svg" viewBox="0 0 ${W} ${H}" width="${W}" height="${H}">${parts.join('')}</svg>`
}

let source // drawn on first use and kept: the pane loads every design, so none pays at load time
export default {
  id: 'violin',
  title: 'Violin plot',
  category: 'spread',
  description: 'Seconds per turn for four models as mirrored density shapes, with an interquartile bar and a median line; two of the shapes have two bulges.',
  element: ui => ui.Svg({ source: (source ??= draw()), alt: `Violin plot of seconds per turn for ${MODELS.length} models, ${TURNS} turns each, with medians and interquartile ranges, sample data`, width: W, height: H }),
}
To use it in a mod: copy the file to your mod's hooks/designs/ and return its element(ui) from a pane's ui.render. How a pane is built.
Code: PolyForm Noncommercial License 1.0.0: noncommercial use only. Required Notice: Copyright 2026 Haruki Nakada (https://modscode.com).