ModsCode / Gallery / Designs / Density contours
Density contours
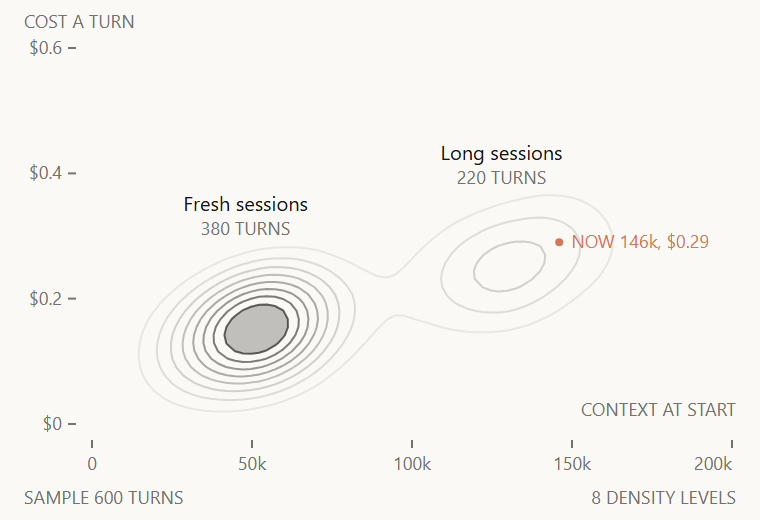
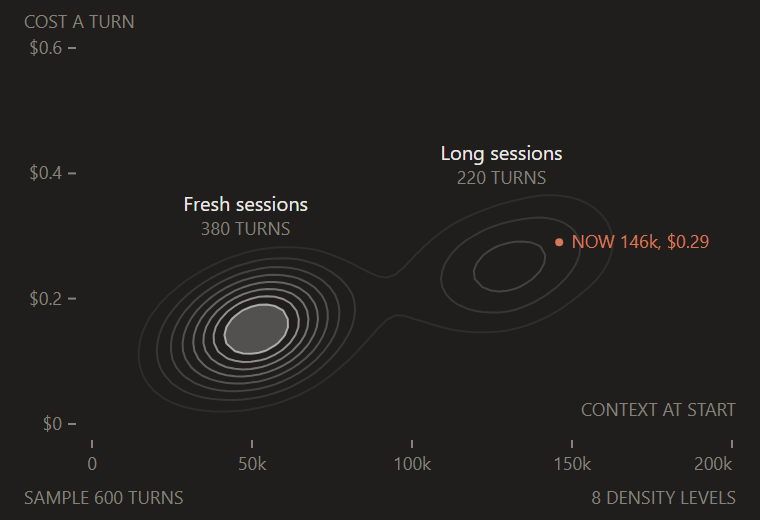
Turns by context size and cost as eight density lines that brighten toward the core, the densest level filled and the current turn in Claude orange.
hooks/designs/contour.mjs
// contour: 600 turns as context size at the start of a turn against the cost of that turn, drawn as
// density contours in candle's look. The density and its iso-lines come from d3-contour's
// contourDensity() (d3-contour 4.0.2, ISC, Mike Bostock), with a 16px bandwidth on a 4px grid; the eight
// thresholds are set by hand at 15% to 85% of the grid's peak, 10% apart, so there are always exactly
// eight levels. The lowest level starts at 15%, not lower, because a fainter rim leaks past $0 and 0k,
// where no turn can be. Each level is a 1px ink line that climbs the opacity ladder from 0.08 at the rim
// to 0.65 at the core, and only the top level is filled (0.25), so the eye lands on the densest spot
// first. The GeoJSON rings are turned into path data by a short helper here, rounded to 1 decimal. The
// sample is seeded (20261033) as two groups: 380 fresh sessions at 48k tokens (spread 14k) and $0.15 a
// turn, and 220 long sessions at 128k (spread 20k) and $0.24, cost rising $0.0016 per 1k of context in
// both; a draw outside the plot is drawn again, so the groups keep exactly 380 and 220. The group names
// sit just above the rim over each group's centre and the Claude orange NOW label takes the first side of its
// dot that no line crosses, both read from the rings, so a new sample cannot push them onto a line. The
// one Claude orange dot is the current turn. Sample data only.
import { contourDensity } from '../vendor/d3.mjs'

const W = 380
const H = 260
const STAGE = '#FAF9F5'
const INK = '#141413'
const MUTED = '#73726C'
const CLAUDE = '#D77757'
const FONT = "'Inter Tight','Segoe UI',system-ui,sans-serif"
const PLOT = { left: 46, right: 366, top: 24, bottom: 212 }
const PW = PLOT.right - PLOT.left
const PH = PLOT.bottom - PLOT.top
const MAX_K = 200 // thousand tokens of context
const MAX_C = 0.6 // dollars a turn
const LEVELS = [0.08, 0.12, 0.18, 0.25, 0.35, 0.42, 0.55, 0.65] // stroke opacity, rim to core
// context k and its spread; base cost and its spread (cost = c0 + $0.0016 per 1k + noise)
const GROUPS = [
  { name: 'Fresh sessions', n: 380, k: 48, sk: 14, c0: 0.07, sc: 0.025 },
  { name: 'Long sessions', n: 220, k: 128, sk: 20, c0: 0.04, sc: 0.045 },
]
const NOW = { k: 146, c: 0.29 }
const f = n => n.toFixed(1)

function rng(seed) {
  return () => (seed = (Math.imul(seed, 1103515245) + 12345) & 0x7fffffff) / 0x7fffffff
}

const text = (x, y, s, { size = 9, fill = MUTED, anchor = 'start', font = FONT } = {}) =>
  `<text x="${f(x)}" y="${f(y)}"${anchor === 'start' ? '' : ` text-anchor="${anchor}"`} font-size="${size}" font-family="${font}" fill="${fill}">${s}</text>`

// Plot-local px, the space the density grid works in; the plot offset is added when the paths are written
const px = k => (PW * k) / MAX_K
const py = c => PH - (PH * c) / MAX_C

// GeoJSON MultiPolygon to path data: every ring of every polygon as M..L..Z
const toPath = geo =>
  geo.coordinates
    .flatMap(poly => poly.map(ring => `M${ring.map(([x, y]) => `${f(x + PLOT.left)} ${f(y + PLOT.top)}`).join('L')}Z`))
    .join('')

// Seeded turns in plot px from [context k, dollars], cost rising with context; the third field is the
// group. A draw outside the plot is redrawn, so each group keeps its count
function sample() {
  const rnd = rng(20261033)
  const normal = () => Math.sqrt(-2 * Math.log(1 - rnd())) * Math.cos(2 * Math.PI * rnd())
  const pts = []
  GROUPS.forEach((g, i) => {
    for (let n = 0; n < g.n; ) {
      const k = g.k + g.sk * normal()
      const c = g.c0 + 0.0016 * k + g.sc * normal()
      if (k > 0 && k < MAX_K && c > 0 && c < MAX_C) {
        pts.push([px(k), py(c), i])
        n++
      }
    }
  })
  return pts
}

function draw() {
  const pts = sample()
  const density = contourDensity().size([PW, PH]).bandwidth(16).cellSize(4).contours(pts)
  const rings = LEVELS.map((_, i) => density(density.max * (0.15 + 0.1 * i)))
  const parts = [`<rect width="${W}" height="${H}" rx="4" fill="${STAGE}"/>`]
  rings.forEach((geo, i) => {
    const d = toPath(geo)
    if (!d) return
    const top = i === LEVELS.length - 1
    parts.push(`<path d="${d}" fill="${top ? INK : 'none'}"${top ? ' fill-opacity="0.25" fill-rule="evenodd"' : ''} stroke="${INK}" stroke-opacity="${LEVELS[i]}" stroke-width="1"/>`)
  })

  // Every ring vertex in stage px; vertices sit at most a 4px cell apart, so a box no vertex comes
  // within 3px of is clear of every line
  const verts = rings.flatMap(g => g.coordinates.flat(2)).map(([x, y]) => [x + PLOT.left, y + PLOT.top])
  const clear = (x0, y0, x1, y1) => !verts.some(([x, y]) => x > x0 - 3 && x < x1 + 3 && y > y0 - 3 && y < y1 + 3)

  // Each group's name sits above the highest rim vertex within 20px of the group's centre
  GROUPS.forEach((g, i) => {
    const cx = PLOT.left + px(g.k)
    const rim = Math.min(...verts.filter(([x]) => Math.abs(x - cx) < 20).map(([, y]) => y))
    parts.push(text(cx, rim - 18, g.name, { size: 10, fill: INK, anchor: 'middle' }))
    parts.push(text(cx, rim - 6, `${pts.filter(p => p[2] === i).length} TURNS`, { anchor: 'middle' }))
  })

  // NOW: the first side of the dot whose label box no ring comes near (5px a char at 9px, 10% slack)
  const nx = PLOT.left + px(NOW.k)
  const ny = PLOT.top + py(NOW.c)
  const label = `NOW ${NOW.k}k, $${NOW.c.toFixed(2)}`
  const w = label.length * 5.5
  const sides = [
    { x: nx + 6, y: ny + 3, anchor: 'start', box: [nx + 6, ny - 4, nx + 6 + w, ny + 3] },
    { x: nx - 6, y: ny + 3, anchor: 'end', box: [nx - 6 - w, ny - 4, nx - 6, ny + 3] },
    { x: nx, y: ny - 7, anchor: 'middle', box: [nx - w / 2, ny - 14, nx + w / 2, ny - 7] },
    { x: nx, y: ny + 13, anchor: 'middle', box: [nx - w / 2, ny + 6, nx + w / 2, ny + 13] },
  ]
  const side = sides.find(s => s.box[0] >= 12 && s.box[2] <= W - 12 && clear(...s.box)) ?? sides[0]
  parts.push(`<circle cx="${f(nx)}" cy="${f(ny)}" r="2" fill="${CLAUDE}"/>`)
  parts.push(text(side.x, side.y, label, { fill: CLAUDE, anchor: side.anchor }))

  for (const c of [0, 0.2, 0.4, 0.6]) {
    const y = PLOT.top + py(c)
    parts.push(`<line x1="${PLOT.left - 12}" x2="${PLOT.left - 8}" y1="${f(y)}" y2="${f(y)}" stroke="${MUTED}" stroke-width="1"/>`)
    parts.push(text(PLOT.left - 15, y + 3, c ? `$${c.toFixed(1)}` : '$0', { anchor: 'end' }))
  }
  for (const k of [0, 50, 100, 150, 200]) {
    const x = PLOT.left + px(k)
    parts.push(`<line x1="${f(x)}" x2="${f(x)}" y1="${PLOT.bottom + 8}" y2="${PLOT.bottom + 12}" stroke="${MUTED}" stroke-width="1"/>`)
    parts.push(text(x, PLOT.bottom + 23, k ? `${k}k` : '0', { anchor: k === MAX_K ? 'end' : 'middle' }))
  }
  parts.push(text(12, 14, 'COST A TURN'))
  parts.push(text(W - 12, PLOT.bottom - 4, 'CONTEXT AT START', { anchor: 'end' }))
  parts.push(text(12, H - 8, `SAMPLE ${pts.length} TURNS`))
  parts.push(text(W - 12, H - 8, '8 DENSITY LEVELS', { anchor: 'end' }))
  return `<svg xmlns="http://www.w3.org/2000/svg" viewBox="0 0 ${W} ${H}" width="${W}" height="${H}">${parts.join('')}</svg>`
}

let source // drawn on first use and kept: the pane loads every design, so none pays at load time
export default {
  id: 'contour',
  title: 'Density contours',
  category: 'spread',
  description: 'Turns by context size and cost as eight density lines that brighten toward the core, the densest level filled and the current turn in Claude orange.',
  element: ui => ui.Svg({ source: (source ??= draw()), alt: 'Density contours of turns by context size and cost in two groups, the current turn marked in Claude orange, sample data', width: W, height: H }),
}
Imports d3-contour 4.0.2 (ISC), bundled with its licence in look's hooks/vendor/.
To use it in a mod: copy the file to your mod's hooks/designs/ and return its element(ui) from a pane's ui.render. How a pane is built.
Code: PolyForm Noncommercial License 1.0.0: noncommercial use only. Required Notice: Copyright 2026 Haruki Nakada (https://modscode.com).