ModsCode / Gallery / Designs / Hexbin plot
Hexbin plot
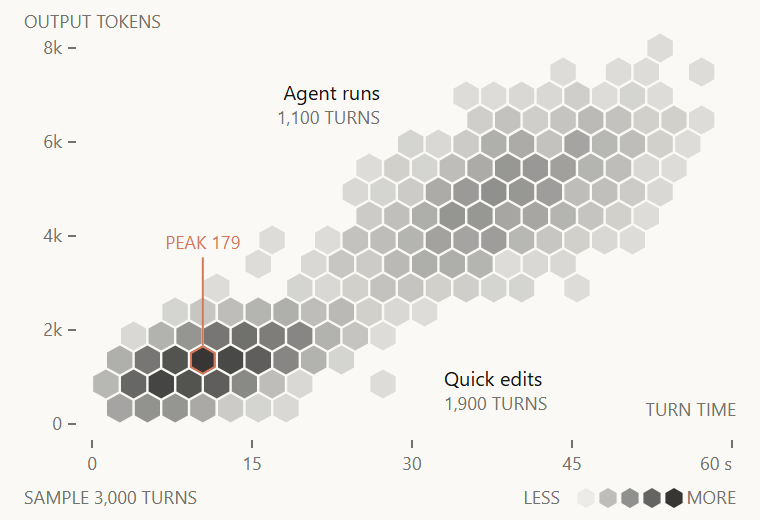
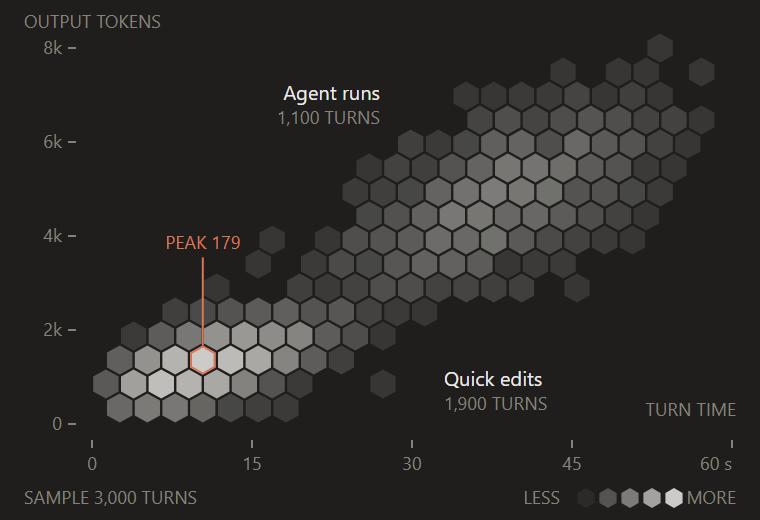
Thousands of turns binned into hexagons by time and output tokens, brighter where turns pile up, with the busiest cell in Claude orange.
hooks/designs/hexbin.mjs
// hexbin: 3,000 Claude Code turns as turn time against output tokens, binned into hexagons of radius 8
// in candle's look. Binning is d3-hexbin's hexbin() (d3-hexbin 0.2.2, BSD-3-Clause, Mike Bostock); the
// cells are drawn here as six rounded vertices at radius 7.3, so a hairline of stage runs between
// neighbours the way the heatmap keeps a gap between its squares. Each cell is ink at the heatmap's ramp,
// 0.06 + 0.79 x v, with v the square root of count / max: the quick-edit core holds about eight times
// as many turns a cell as the agent cloud, and a straight ramp left that cloud near the idle step. The
// legend reads the same ramp from LESS to MORE, and the busiest cell is the one Claude orange outline. The sample
// is seeded (20261032) as two clusters: 1,900 quick edits near 10s and 1.2k tokens, and 1,100 agent runs
// near 38s and 4.8k tokens, both sloped (longer turns write more); a draw outside 2 to 58s or 0.2k to 8k
// tokens is drawn again, so the counts stay exact. d3-hexbin lays its grid from the stage's corner, which
// left a row of cells hanging below the zero line onto the tick stubs; here the grid is laid from the
// plot instead (a row centre 8px above zero, a column centre on the left edge), and with those draw
// limits (no real turn is under 2s or 200 tokens) no cell crosses the zero line or either side of the
// plot; the top row may rise above the plot's top but stays 16px inside the stage. Sample data only.
import { hexbin } from '../vendor/d3.mjs'

const W = 380
const H = 260
const STAGE = '#FAF9F5'
const INK = '#141413'
const MUTED = '#73726C'
const CLAUDE = '#D77757'
const FONT = "'Inter Tight','Segoe UI',system-ui,sans-serif"
const PLOT = { left: 46, right: 366, top: 24, bottom: 212 }
const MAX_S = 60
const MAX_K = 8
const KEEP = { s: [2, 58], k: [0.2, 8] } // a draw outside these is redrawn; see the header
const R = 8 // bin radius
const CELL = 7.3 // drawn radius
const f = n => n.toFixed(1)
const comma = n => String(n).replace(/\B(?=(\d{3})+(?!\d))/g, ',')

function rng(seed) {
  return () => (seed = (Math.imul(seed, 1103515245) + 12345) & 0x7fffffff) / 0x7fffffff
}

const text = (x, y, s, { size = 9, fill = MUTED, anchor = 'start', font = FONT } = {}) =>
  `<text x="${f(x)}" y="${f(y)}"${anchor === 'start' ? '' : ` text-anchor="${anchor}"`} font-size="${size}" font-family="${font}" fill="${fill}">${s}</text>`

const ink = v => (0.06 + 0.79 * v).toFixed(2)
const hex = (cx, cy, r) => {
  let d = ''
  for (let i = 0; i < 6; i++) {
    const a = (Math.PI / 3) * i - Math.PI / 2 // pointy top, as hexbin lays its rows
    d += `${i ? 'L' : 'M'}${f(cx + r * Math.cos(a))} ${f(cy + r * Math.sin(a))}`
  }
  return `${d}Z`
}

const sx = s => PLOT.left + ((PLOT.right - PLOT.left) * s) / MAX_S
const sy = k => PLOT.bottom - ((PLOT.bottom - PLOT.top) * k) / MAX_K

// Seeded turns in px, from [seconds, thousand output tokens]; the third field marks a quick edit
function sample() {
  const rnd = rng(20261032)
  const normal = () => Math.sqrt(-2 * Math.log(1 - rnd())) * Math.cos(2 * Math.PI * rnd())
  const pts = []
  while (pts.length < 3000) {
    const a = normal()
    const b = normal()
    const quick = pts.length < 1900 // a draw outside the plot is redrawn, so each cluster keeps its count
    const p = quick ? [10 + 5.5 * a, 1.2 + 0.35 * a + 0.4 * b] : [38 + 7 * a, 4.8 + 0.7 * a + 0.75 * b]
    if (p[0] > KEEP.s[0] && p[0] < KEEP.s[1] && p[1] > KEEP.k[0] && p[1] < KEEP.k[1]) pts.push([sx(p[0]), sy(p[1]), quick])
  }
  return pts
}

function draw() {
  const pts = sample()
  // Binned in plot-local px so the grid starts at the plot, then moved back to stage px
  const bins = hexbin()
    .radius(R)
    .x(p => p[0] - PLOT.left)
    .y(p => p[1] - PLOT.bottom + R)(pts)
    .map(b => ({ x: b.x + PLOT.left, y: b.y + PLOT.bottom - R, length: b.length }))
  const max = Math.max(...bins.map(b => b.length))
  const peak = bins.find(b => b.length === max)
  const parts = [`<rect width="${W}" height="${H}" rx="4" fill="${STAGE}"/>`]
  for (const b of bins) parts.push(`<path d="${hex(b.x, b.y, CELL)}" fill="${INK}" fill-opacity="${ink(Math.sqrt(b.length / max))}"/>`)

  // The peak's label steps up out of the cloud: a 1px leader to just above the column's top cell
  const column = bins.filter(b => Math.abs(b.x - peak.x) < R)
  const lift = Math.min(...column.map(b => b.y)) - CELL - 8
  parts.push(`<line x1="${f(peak.x)}" x2="${f(peak.x)}" y1="${f(peak.y - CELL)}" y2="${f(lift)}" stroke="${CLAUDE}" stroke-width="1"/>`)
  parts.push(`<path d="${hex(peak.x, peak.y, CELL - 0.5)}" fill="none" stroke="${CLAUDE}" stroke-width="1"/>`)
  parts.push(text(peak.x, lift - 4, `PEAK ${max}`, { fill: CLAUDE, anchor: 'middle' }))

  // Each cluster is named in the empty space beside it, with the turns it holds
  const quick = pts.filter(p => p[2]).length
  parts.push(text(sx(33), sy(0.8), 'Quick edits', { size: 10, fill: INK }))
  parts.push(text(sx(33), sy(0.8) + 12, `${comma(quick)} TURNS`))
  parts.push(text(sx(27), sy(6.9), 'Agent runs', { size: 10, fill: INK, anchor: 'end' }))
  parts.push(text(sx(27), sy(6.9) + 12, `${comma(pts.length - quick)} TURNS`, { anchor: 'end' }))

  for (const k of [0, 2, 4, 6, 8]) {
    parts.push(`<line x1="${PLOT.left - 12}" x2="${PLOT.left - 8}" y1="${f(sy(k))}" y2="${f(sy(k))}" stroke="${MUTED}" stroke-width="1"/>`)
    parts.push(text(PLOT.left - 15, sy(k) + 3, k ? `${k}k` : '0', { anchor: 'end' }))
  }
  for (const s of [0, 15, 30, 45, 60]) {
    parts.push(`<line x1="${f(sx(s))}" x2="${f(sx(s))}" y1="${PLOT.bottom + 8}" y2="${PLOT.bottom + 12}" stroke="${MUTED}" stroke-width="1"/>`)
    parts.push(text(sx(s), PLOT.bottom + 23, s === MAX_S ? `${s} s` : String(s), { anchor: s === MAX_S ? 'end' : 'middle' }))
  }
  parts.push(text(12, 14, 'OUTPUT TOKENS'))
  parts.push(text(W - 12, PLOT.bottom - 4, 'TURN TIME', { anchor: 'end' }))

  // The legend uses the cells' own ramp, read from idle to busy
  const STEPS = [0, 0.25, 0.5, 0.75, 1]
  const lx = 288
  parts.push(text(lx - 8, H - 8, 'LESS', { anchor: 'end' }))
  STEPS.forEach((v, i) => parts.push(`<path d="${hex(lx + 5 + i * 11, H - 11, 5)}" fill="${INK}" fill-opacity="${ink(v)}"/>`))
  parts.push(text(W - 12, H - 8, 'MORE', { anchor: 'end' }))
  parts.push(text(12, H - 8, 'SAMPLE 3,000 TURNS'))
  return `<svg xmlns="http://www.w3.org/2000/svg" viewBox="0 0 ${W} ${H}" width="${W}" height="${H}">${parts.join('')}</svg>`
}

let source // drawn on first use and kept: the pane loads every design, so none pays at load time
export default {
  id: 'hexbin',
  title: 'Hexbin plot',
  category: 'spread',
  description: 'Thousands of turns binned into hexagons by time and output tokens, brighter where turns pile up, with the busiest cell in Claude orange.',
  element: ui => ui.Svg({ source: (source ??= draw()), alt: 'Hexbin plot of turns by turn time and output tokens in two clusters, quick edits and agent runs, sample data', width: W, height: H }),
}
Imports d3-hexbin 0.2.2 (BSD-3-Clause), bundled with its licence in look's hooks/vendor/.
To use it in a mod: copy the file to your mod's hooks/designs/ and return its element(ui) from a pane's ui.render. How a pane is built.
Code: PolyForm Noncommercial License 1.0.0: noncommercial use only. Required Notice: Copyright 2026 Haruki Nakada (https://modscode.com).