ModsCode / Gallery / Designs / Box plots
Box plots
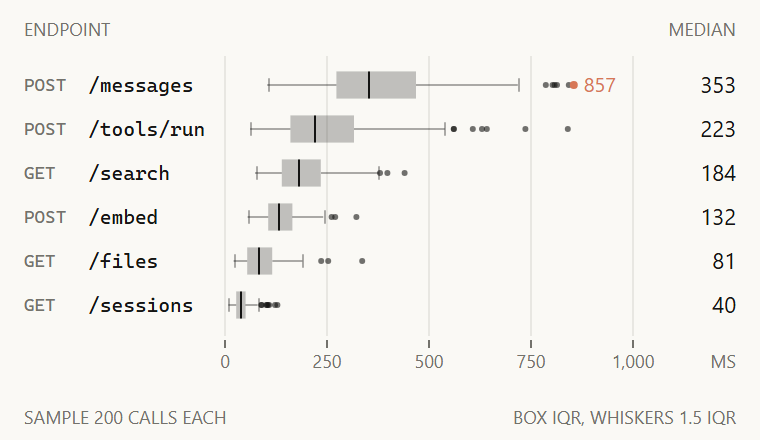
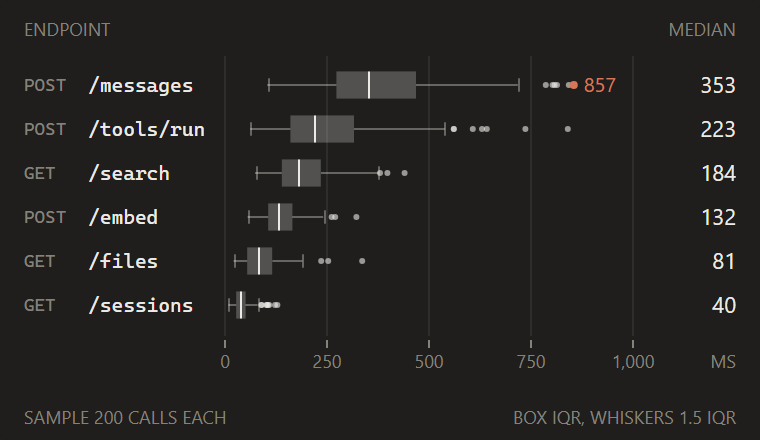
Response time for six API endpoints on one scale: quartile boxes, a median line, Tukey whiskers and outlier dots, the slowest call in Claude orange.
hooks/designs/box-plot.mjs
// box-plot: the spread of response time for six API endpoints, 200 calls each, in candle's look. Each
// endpoint is log-normal around its own median (360, 250, 190, 130, 85 and 40 ms, sigma 0.30 to 0.50),
// so the boxes lean right the way real latencies do. Rows follow dumbbell: the method and path in a
// mono column, one shared scale, the median value right-aligned at W - 12. The box spans the quartiles
// at 25% ink (an area fill) and takes candle's 62% of its row; the median is a 1px full-ink line; the
// whiskers reach the furthest call within 1.5 IQR of the box (Tukey's rule) at 35% ink; calls past them
// are outliers, dots of r=1.5 (smaller than the house r=2, as there can be several in a row) at 60%.
// The slowest call of all is the one Claude orange, at r=2 with its value. The scale ends on the whole 250 ms past
// that call plus 15% room, so its label fits inside the plot. Every number is computed from the sample
// in draw(); with this seed the medians land on 353, 223, 184, 132, 81 and 40 ms and the slowest call
// on 857 ms (POST /messages). Normal draws use the Box-Muller transform (Box and Muller, 1958);
// quartiles interpolate linearly between order statistics, the rule of d3-array's quantile (ISC),
// written out here. Sample data only.
const W = 380
const H = 220
const STAGE = '#FAF9F5'
const INK = '#141413'
const MUTED = '#73726C'
const CLAUDE = '#D77757'
const FONT = "'Inter Tight','Segoe UI',system-ui,sans-serif"
const MONO = "ui-monospace,'Cascadia Mono',Consolas,monospace"
const X0 = 112 // 0 ms; the method and path sit in the column before it
const X1 = 316 // the scale end; the median values sit after it
const ROW0 = 42
const ROW = 22
const PLOT = { top: 28, bottom: 168 }
const CALLS = 200
const f = n => n.toFixed(1)

// Method, path, median ms and log sigma, slowest first
const ENDPOINTS = [
  ['POST', '/messages', 360, 0.38],
  ['POST', '/tools/run', 250, 0.5],
  ['GET', '/search', 190, 0.34],
  ['POST', '/embed', 130, 0.3],
  ['GET', '/files', 85, 0.45],
  ['GET', '/sessions', 40, 0.4],
]

// A seeded walk, so the picture is the same on every render
function rng(seed) {
  return () => (seed = (Math.imul(seed, 1103515245) + 12345) & 0x7fffffff) / 0x7fffffff
}

const text = (x, y, s, { size = 9, fill = MUTED, anchor = 'start', font = FONT } = {}) =>
  `<text x="${f(x)}" y="${f(y)}"${anchor === 'start' ? '' : ` text-anchor="${anchor}"`} font-size="${size}" font-family="${font}" fill="${fill}">${s}</text>`
const comma = n => String(n).replace(/\B(?=(\d{3})+(?!\d))/g, ',')
const quantile = (sorted, p) => {
  const i = (sorted.length - 1) * p
  const lo = Math.floor(i)
  return sorted[lo] + (sorted[Math.min(lo + 1, sorted.length - 1)] - sorted[lo]) * (i - lo)
}

// Five numbers and the outliers for each endpoint, from 200 log-normal calls
function sample() {
  const rnd = rng(20261037)
  const normal = () => Math.sqrt(-2 * Math.log(1 - rnd())) * Math.cos(2 * Math.PI * rnd())
  return ENDPOINTS.map(([method, path, median, sigma]) => {
    const ms = Array.from({ length: CALLS }, () => median * Math.exp(sigma * normal())).sort((a, b) => a - b)
    const q1 = quantile(ms, 0.25)
    const q2 = quantile(ms, 0.5)
    const q3 = quantile(ms, 0.75)
    const fence = 1.5 * (q3 - q1)
    const inside = ms.filter(v => v >= q1 - fence && v <= q3 + fence)
    const lo = inside[0]
    const hi = inside[inside.length - 1]
    return { method, path, q1, q2, q3, lo, hi, out: ms.filter(v => v < lo || v > hi) }
  })
}

function draw() {
  const rows = sample()
  const slowest = Math.max(...rows.map(r => r.out.length ? r.out[r.out.length - 1] : r.hi))
  const END = Math.ceil((slowest * 1.15) / 250) * 250
  const x = ms => X0 + ((X1 - X0) * ms) / END
  const box = ROW * 0.62
  const parts = [`<rect width="${W}" height="${H}" rx="4" fill="${STAGE}"/>`]

  parts.push(text(12, 18, 'ENDPOINT'))
  parts.push(text(W - 12, 18, 'MEDIAN', { anchor: 'end' }))
  for (let t = 0; t <= END; t += 250) {
    const tx = Math.round(x(t)) + 0.5
    parts.push(`<line x1="${f(tx)}" x2="${f(tx)}" y1="${PLOT.top}" y2="${PLOT.bottom}" stroke="${INK}" stroke-opacity="0.08" stroke-width="1"/>`)
    parts.push(`<line x1="${f(tx)}" x2="${f(tx)}" y1="${PLOT.bottom + 2}" y2="${PLOT.bottom + 6}" stroke="${MUTED}" stroke-width="1"/>`)
    parts.push(text(tx, PLOT.bottom + 16, comma(t), { anchor: 'middle' }))
  }
  parts.push(text(W - 12, PLOT.bottom + 16, 'MS', { anchor: 'end' }))

  rows.forEach((r, i) => {
    const cy = ROW0 + i * ROW + 0.5 // on a pixel centre so the 1px whiskers stay sharp
    const top = cy - box / 2
    parts.push(text(12, cy + 3, r.method, { font: MONO }))
    parts.push(text(44, cy + 3.5, r.path, { size: 10, fill: INK, font: MONO }))
    // Whiskers under the box, each with a cap half the box tall
    for (const [from, to] of [[r.lo, r.q1], [r.q3, r.hi]]) {
      parts.push(`<line x1="${f(x(from))}" x2="${f(x(to))}" y1="${f(cy)}" y2="${f(cy)}" stroke="${INK}" stroke-opacity="0.35" stroke-width="1"/>`)
    }
    for (const end of [r.lo, r.hi]) {
      const ex = Math.round(x(end)) + 0.5
      parts.push(`<line x1="${f(ex)}" x2="${f(ex)}" y1="${f(cy - box / 4)}" y2="${f(cy + box / 4)}" stroke="${INK}" stroke-opacity="0.35" stroke-width="1"/>`)
    }
    parts.push(`<rect x="${f(x(r.q1))}" y="${f(top)}" width="${f(x(r.q3) - x(r.q1))}" height="${f(box)}" fill="${INK}" fill-opacity="0.25"/>`)
    const mx = Math.round(x(r.q2)) + 0.5
    parts.push(`<line x1="${f(mx)}" x2="${f(mx)}" y1="${f(top)}" y2="${f(top + box)}" stroke="${INK}" stroke-width="1"/>`)
    for (const v of r.out) {
      if (v === slowest) continue
      parts.push(`<circle cx="${f(x(v))}" cy="${f(cy)}" r="1.5" fill="${INK}" fill-opacity="0.6"/>`)
    }
    if (r.out.includes(slowest) || r.hi === slowest) {
      parts.push(`<circle cx="${f(x(slowest))}" cy="${f(cy)}" r="2" fill="${CLAUDE}"/>`)
      parts.push(text(x(slowest) + 5, cy + 3.5, comma(Math.round(slowest)), { size: 10, fill: CLAUDE }))
    }
    parts.push(text(W - 12, cy + 4, String(Math.round(r.q2)), { size: 11, fill: INK, anchor: 'end' }))
  })

  parts.push(text(W - 12, H - 8, 'BOX IQR, WHISKERS 1.5 IQR', { anchor: 'end' }))
  parts.push(text(12, H - 8, `SAMPLE ${CALLS} CALLS EACH`))
  return `<svg xmlns="http://www.w3.org/2000/svg" viewBox="0 0 ${W} ${H}" width="${W}" height="${H}">${parts.join('')}</svg>`
}

let source // drawn on first use and kept: the pane loads every design, so none pays at load time
export default {
  id: 'box-plot',
  title: 'Box plots',
  category: 'spread',
  description: 'Response time for six API endpoints on one scale: quartile boxes, a median line, Tukey whiskers and outlier dots, the slowest call in Claude orange.',
  element: ui => ui.Svg({ source: (source ??= draw()), alt: `Box plots of response time for ${ENDPOINTS.length} API endpoints, ${CALLS} calls each, with the slowest call marked, sample data`, width: W, height: H }),
}
To use it in a mod: copy the file to your mod's hooks/designs/ and return its element(ui) from a pane's ui.render. How a pane is built.
Code: PolyForm Noncommercial License 1.0.0: noncommercial use only. Required Notice: Copyright 2026 Haruki Nakada (https://modscode.com).