ModsCode / Gallery / Designs / Sparklines
Sparklines
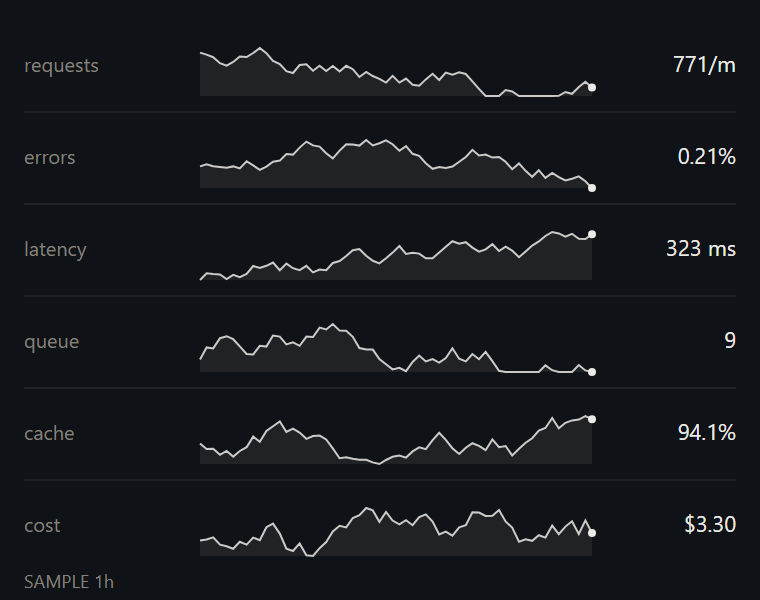
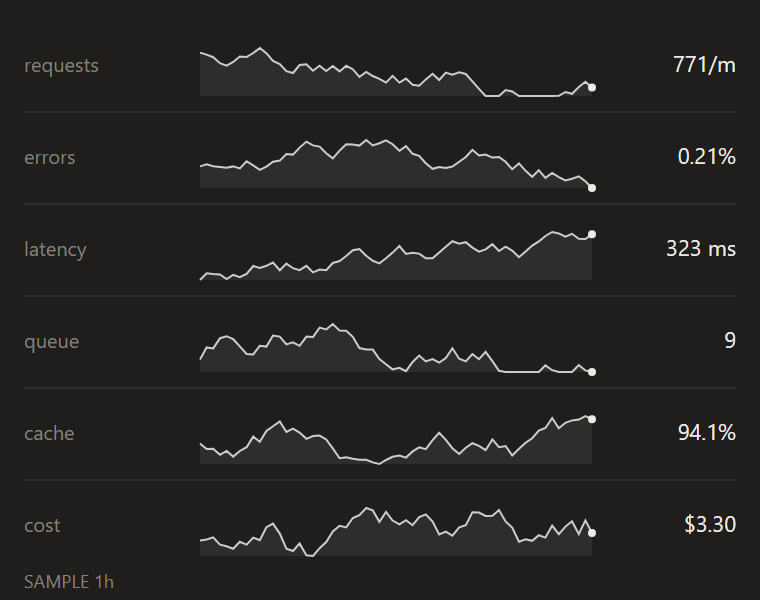
Six sparkline rows, each a 1px line over a faint area with a dot and its last value, so level and move read without axes.
hooks/designs/sparks.mjs
// sparks: six sparkline rows in candle's look. Each row is a 1px line over an area at 8% ink,
// a dot on the last value and the value right-aligned, so the level and its recent move read without
// axes. Each row has its own range, so a flat metric still shows its wiggle. Sample data only.
const W = 380
const H = 300
const STAGE = '#FAF9F5'
const INK = '#141413'
const MUTED = '#73726C'
const FONT = "'Inter Tight','Segoe UI',system-ui,sans-serif"
const TOP = 16
const ROW = 46
const PLOT = { left: 100, right: 296, top: 8, bottom: 32 } // offsets inside one row
const N = 60

// A seeded walk per metric: the same picture every time, so the rows can be compared by eye
function walk(seed, base, step, cap) {
  let s = seed
  const rnd = () => (s = (Math.imul(s, 1103515245) + 12345) & 0x7fffffff) / 0x7fffffff
  const out = []
  let v = base
  for (let i = 0; i < N; i++) {
    // Clamped so each metric stays plausible (a percentage cannot pass 100)
    v = Math.min(cap, Math.max(base * 0.5, v + (rnd() - 0.5) * step))
    out.push(v)
  }
  return out
}

const grouped = v => String(Math.round(v)).replace(/\B(?=(\d{3})+(?!\d))/g, ',')

const METRICS = [
  { name: 'requests', seed: 11, base: 1280, step: 260, fmt: v => grouped(v) + '/m' },
  { name: 'errors', seed: 23, base: 0.42, step: 0.2, fmt: v => v.toFixed(2) + '%' },
  { name: 'latency', seed: 37, base: 212, step: 48, fmt: v => Math.round(v) + ' ms' },
  { name: 'queue', seed: 41, base: 17, step: 9, fmt: v => String(Math.round(v)) },
  { name: 'cache', seed: 53, base: 91.3, step: 3.4, cap: 99.4, fmt: v => v.toFixed(1) + '%' },
  { name: 'cost', seed: 67, base: 3.18, step: 0.7, fmt: v => '$' + v.toFixed(2) },
]

function row(m, i) {
  const vals = walk(m.seed, m.base, m.step, m.cap ?? Infinity)
  const lo = Math.min(...vals)
  const hi = Math.max(...vals)
  const top = TOP + i * ROW
  const y0 = top + PLOT.top
  const y1 = top + PLOT.bottom
  const x = k => PLOT.left + ((PLOT.right - PLOT.left) * k) / (N - 1)
  const y = v => y1 - ((v - lo) / (hi - lo || 1)) * (y1 - y0)
  const line = vals.map((v, k) => `${x(k).toFixed(1)},${y(v).toFixed(1)}`).join(' ')
  const last = vals[N - 1]
  const parts = [
    `<text x="12" y="${top + 20}" font-size="10" font-family="${FONT}" fill="${MUTED}">${m.name}</text>`,
    `<polygon points="${PLOT.left},${y1} ${line} ${PLOT.right},${y1}" fill="${INK}" fill-opacity="0.08"/>`,
    `<polyline points="${line}" fill="none" stroke="${INK}" stroke-opacity="0.85" stroke-width="1"/>`,
    `<circle cx="${x(N - 1).toFixed(1)}" cy="${y(last).toFixed(1)}" r="2" fill="${INK}"/>`,
    `<text x="${W - 12}" y="${top + 20}" text-anchor="end" font-size="11" font-family="${FONT}" fill="${INK}">${m.fmt(last)}</text>`,
  ]
  // A hairline between rows, not after the last one
  if (i < METRICS.length - 1) {
    parts.push(`<line x1="12" x2="${W - 12}" y1="${top + ROW - 6}" y2="${top + ROW - 6}" stroke="${INK}" stroke-opacity="0.08"/>`)
  }
  return parts.join('')
}

const SOURCE = `<svg xmlns="http://www.w3.org/2000/svg" viewBox="0 0 ${W} ${H}" width="${W}" height="${H}"><rect width="${W}" height="${H}" rx="4" fill="${STAGE}"/>${METRICS.map(row).join('')}<text x="12" y="${H - 6}" font-size="9" font-family="${FONT}" fill="${MUTED}">SAMPLE 1h</text></svg>`

export default {
  id: 'sparks',
  title: 'Sparklines',
  category: 'time',
  description: 'Six sparkline rows, each a 1px line over a faint area with a dot and its last value, so level and move read without axes.',
  element: ui => ui.Svg({ source: SOURCE, alt: 'Six sparkline rows with their last values, sample data', width: W, height: H }),
}
To use it in a mod: copy the file to your mod's hooks/designs/ and return its element(ui) from a pane's ui.render. How a pane is built.
Code: PolyForm Noncommercial License 1.0.0: noncommercial use only. Required Notice: Copyright 2026 Haruki Nakada (https://modscode.com).