ModsCode / Gallery / Designs / Candlestick chart
Candlestick chart
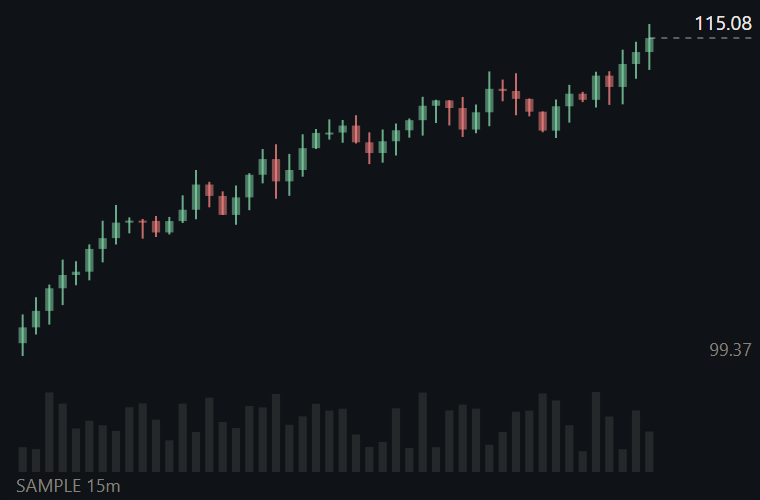
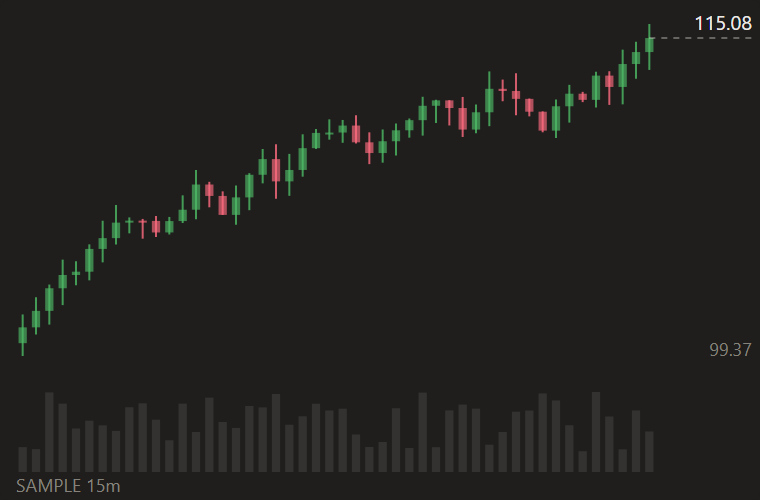
Candlestick chart of 15-minute bars with volume and a dashed last-value line; the look every other design follows.
hooks/designs/candle.mjs
// candle: a candlestick chart, the look the other designs follow. No frame and no axis
// lines; the body is 65% fill at 62% of a slot (55% left the light theme's green at 2.2:1 on the ivory), the wick 1px at 80%, volume in the bottom 18% at 10%
// ink, and the last value is a dashed line at 35% ink that runs past the plot. Sample data only.
const W = 380
const H = 250
const PRICE = { top: 12, bottom: 178 }
const VOL = { top: 196, bottom: 236 }
const PAD = { left: 8, right: 52 } // the right space holds the value labels; the last line runs into it
const UP = '#2C7A39'
const DOWN = '#AB2B3F'
const INK = '#141413'
const MUTED = '#73726C'
const STAGE = '#FAF9F5'
const FONT = "'Inter Tight','Segoe UI',system-ui,sans-serif"

// A seeded walk: the same picture every time, so it can be compared by eye
function sample(n) {
  let seed = 20261009
  const rnd = () => (seed = (Math.imul(seed, 1103515245) + 12345) & 0x7fffffff) / 0x7fffffff
  const bars = []
  let close = 100
  for (let i = 0; i < n; i++) {
    const open = close
    close = Math.max(60, open + (rnd() - 0.48) * 2.4)
    const high = Math.max(open, close) + rnd() * 0.9
    const low = Math.min(open, close) - rnd() * 0.9
    bars.push({ open, high, low, close, vol: 0.3 + rnd() })
  }
  return bars
}

function chartSource(bars) {
  const n = bars.length
  const lo = Math.min(...bars.map(b => b.low))
  const hi = Math.max(...bars.map(b => b.high))
  const vmax = Math.max(...bars.map(b => b.vol))
  const plotW = W - PAD.left - PAD.right
  const slot = plotW / n
  const body = Math.max(1, slot * 0.62)
  const y = v => PRICE.bottom - ((v - lo) / (hi - lo)) * (PRICE.bottom - PRICE.top)
  const vy = v => VOL.bottom - (v / vmax) * (VOL.bottom - VOL.top)

  const parts = [`<rect width="${W}" height="${H}" rx="4" fill="${STAGE}"/>`]
  bars.forEach((b, i) => {
    const cx = PAD.left + slot * (i + 0.5)
    const color = b.close >= b.open ? UP : DOWN
    const top = y(Math.max(b.open, b.close))
    const bottom = y(Math.min(b.open, b.close))
    parts.push(`<rect x="${cx - body / 2}" y="${vy(b.vol)}" width="${body}" height="${VOL.bottom - vy(b.vol)}" fill="${INK}" fill-opacity="0.1"/>`)
    parts.push(`<line x1="${cx}" x2="${cx}" y1="${y(b.high)}" y2="${y(b.low)}" stroke="${color}" stroke-opacity="0.8" stroke-width="1"/>`)
    parts.push(`<rect x="${cx - body / 2}" y="${top}" width="${body}" height="${Math.max(1, bottom - top)}" fill="${color}" fill-opacity="0.65"/>`)
  })

  const last = bars[n - 1]
  const ly = y(last.close)
  const lx = PAD.left + slot * (n - 0.5)
  parts.push(`<line x1="${lx}" x2="${W - 4}" y1="${ly}" y2="${ly}" stroke="${INK}" stroke-opacity="0.35" stroke-dasharray="3 3"/>`)
  parts.push(`<text x="${W - 4}" y="${ly - 4}" text-anchor="end" font-size="10" font-family="${FONT}" fill="${INK}">${last.close.toFixed(2)}</text>`)
  // The range labels step aside when the last value sits on them (a close near the high or low)
  const clear = yy => Math.abs(yy - ly) > 12
  if (clear(PRICE.top + 8)) parts.push(`<text x="${W - 4}" y="${PRICE.top + 8}" text-anchor="end" font-size="9" font-family="${FONT}" fill="${MUTED}">${hi.toFixed(2)}</text>`)
  if (clear(PRICE.bottom)) parts.push(`<text x="${W - 4}" y="${PRICE.bottom}" text-anchor="end" font-size="9" font-family="${FONT}" fill="${MUTED}">${lo.toFixed(2)}</text>`)
  parts.push(`<text x="${PAD.left}" y="${H - 4}" font-size="9" font-family="${FONT}" fill="${MUTED}">SAMPLE 15m</text>`)
  return `<svg xmlns="http://www.w3.org/2000/svg" viewBox="0 0 ${W} ${H}" width="${W}" height="${H}">${parts.join('')}</svg>`
}

const SOURCE = chartSource(sample(48))

export default {
  id: 'candle',
  title: 'Candlestick chart',
  category: 'time',
  description: 'Candlestick chart of 15-minute bars with volume and a dashed last-value line; the look every other design follows.',
  element: ui => ui.Svg({ source: SOURCE, alt: 'Candlestick chart with sample data', width: W, height: H }),
}
To use it in a mod: copy the file to your mod's hooks/designs/ and return its element(ui) from a pane's ui.render. How a pane is built.
Code: PolyForm Noncommercial License 1.0.0: noncommercial use only. Required Notice: Copyright 2026 Haruki Nakada (https://modscode.com).