ModsCode / Gallery / Designs / Polar area chart
Polar area chart
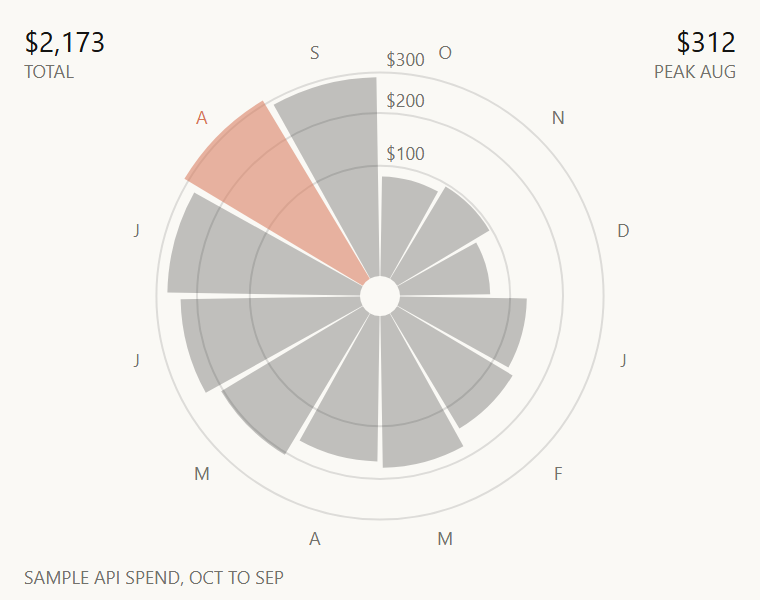
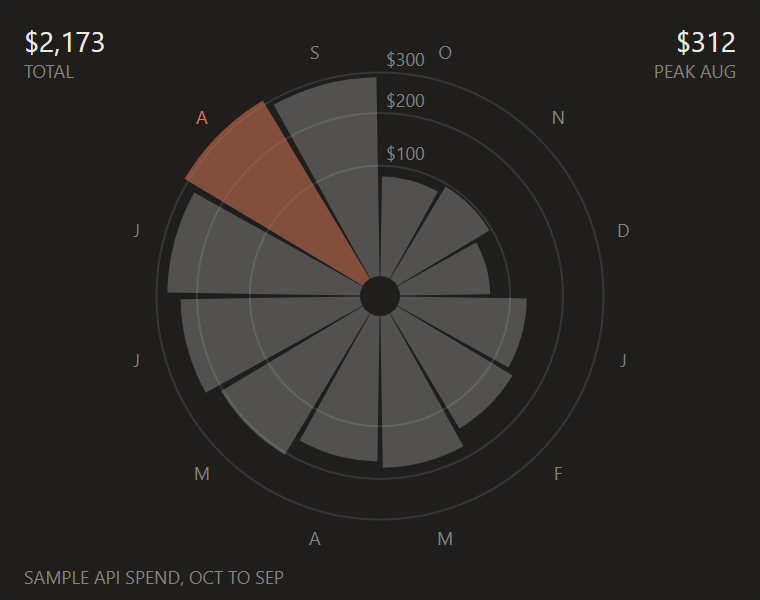
Monthly spend as equal-angle wedges whose area carries the value, with square-root rings, the total and the one peak month marked.
hooks/designs/polar-area.mjs
// polar-area: twelve months of Claude API spend, October 2025 to September 2026, as a polar area
// chart in candle's look. Every wedge has the same angle, so its area must carry the value: the radius
// is the square root of the value, measured out from a 10px hole that keeps the wedges from meeting in
// a point (r = sqrt(R_IN^2 + v/max * (R_MAX^2 - R_IN^2))). Ink wedges take the 25% area step (55%, candle's
// body, was tried and twelve wedges filling the stage outweighed candle) and a 2px gap between
// neighbours is measured on the mid-radius, as donut measures it. Hairline rings at $100, $200 and $300
// on the same square-root scale give the reading. August's $312 is the peak and the one Claude orange wedge, at
// the 55% body step; the total and the peak are spelled out in the top corners. The months add up to $2,173:
// 84, 96, 71, 128, 142, 176, 163, 205, 238, 271, 312, 287 (December dips for the holidays). Sample data only.
const W = 380
const H = 300
const STAGE = '#FAF9F5'
const INK = '#141413'
const MUTED = '#73726C'
const CLAUDE = '#D77757'
const FONT = "'Inter Tight','Segoe UI',system-ui,sans-serif"
const CX = 190
const CY = 148
const R_IN = 10
const R_MAX = 114
const R_MID = (R_IN + R_MAX) / 2
const GAP = 2 // px between two wedges, along the mid-radius
const RINGS = [100, 200, 300]
const f = n => n.toFixed(1)

// USD a month, in wedge order clockwise from 12 o'clock; the peak's corner label reads its name from SHORT
const SHORT = ['OCT', 'NOV', 'DEC', 'JAN', 'FEB', 'MAR', 'APR', 'MAY', 'JUN', 'JUL', 'AUG', 'SEP']
const MONTHS = [
  ['O', 84], ['N', 96], ['D', 71], ['J', 128], ['F', 142], ['M', 176],
  ['A', 163], ['M', 205], ['J', 238], ['J', 271], ['A', 312], ['S', 287],
]

const text = (x, y, s, { size = 9, fill = MUTED, anchor = 'start' } = {}) =>
  `<text x="${f(x)}" y="${f(y)}"${anchor === 'start' ? '' : ` text-anchor="${anchor}"`} font-size="${size}" font-family="${FONT}" fill="${fill}">${s}</text>`
const at = (r, a) => [CX + r * Math.cos(a), CY + r * Math.sin(a)]
const usd = n => '$' + String(n).replace(/\B(?=(\d{3})+$)/g, ',') // thousands commas without Intl, which is slow to load

function draw() {
  const max = Math.max(...MONTHS.map(m => m[1]))
  const radius = v => Math.sqrt(R_IN * R_IN + (v / max) * (R_MAX * R_MAX - R_IN * R_IN))
  const peak = MONTHS.findIndex(m => m[1] === max)
  const step = (2 * Math.PI) / MONTHS.length
  const parts = [`<rect width="${W}" height="${H}" rx="4" fill="${STAGE}"/>`]

  // The rings sit behind the wedges and show where the short wedges stop
  for (const v of RINGS) {
    const r = radius(v)
    parts.push(`<circle cx="${CX}" cy="${CY}" r="${f(r)}" fill="none" stroke="${INK}" stroke-opacity="0.12"/>`)
  }

  MONTHS.forEach(([, v], i) => {
    // Half the gap comes off each side, so two neighbours are GAP apart on the mid-radius
    const d = GAP / R_MID / 2
    const a0 = -Math.PI / 2 + i * step + d
    const a1 = -Math.PI / 2 + (i + 1) * step - d
    const r = radius(v)
    const [x0, y0] = at(r, a0)
    const [x1, y1] = at(r, a1)
    const [x2, y2] = at(R_IN, a1)
    const [x3, y3] = at(R_IN, a0)
    const fill = i === peak ? `fill="${CLAUDE}" fill-opacity="0.55"` : `fill="${INK}" fill-opacity="0.25"`
    parts.push(`<path d="M${f(x0)} ${f(y0)} A${f(r)} ${f(r)} 0 0 1 ${f(x1)} ${f(y1)} L${f(x2)} ${f(y2)} A${R_IN} ${R_IN} 0 0 0 ${f(x3)} ${f(y3)}Z" ${fill}/>`)
  })

  // Ring values sit just above each ring on the 12 o'clock line, beside October: at $84 it ends inside
  // the $100 ring, so all three labels land on bare stage (September, left of the line, nearly fills it)
  for (const v of RINGS) parts.push(text(CX + 3, CY - radius(v) - 3, usd(v)))

  MONTHS.forEach(([name], i) => {
    const [x, y] = at(R_MAX + 12, -Math.PI / 2 + (i + 0.5) * step)
    parts.push(text(x, y + 3, name, { fill: i === peak ? CLAUDE : MUTED, anchor: 'middle' }))
  })

  const total = MONTHS.reduce((s, m) => s + m[1], 0)
  parts.push(text(12, 26, usd(total), { size: 14, fill: INK }))
  parts.push(text(12, 39, 'TOTAL'))
  // The peak value is ink: the Claude orange wedge and its letter already point at it, and a 14px Claude orange
  // number in the far corner made a second bright spot
  parts.push(text(W - 12, 26, usd(max), { size: 14, fill: INK, anchor: 'end' }))
  parts.push(text(W - 12, 39, `PEAK ${SHORT[peak]}`, { anchor: 'end' }))
  parts.push(text(12, H - 8, 'SAMPLE API SPEND, OCT TO SEP'))
  return `<svg xmlns="http://www.w3.org/2000/svg" viewBox="0 0 ${W} ${H}" width="${W}" height="${H}">${parts.join('')}</svg>`
}

let source // drawn on first use and kept: the pane loads every design, so none pays at load time
export default {
  id: 'polar-area',
  title: 'Polar area chart',
  category: 'parts',
  description: 'Monthly spend as equal-angle wedges whose area carries the value, with square-root rings, the total and the one peak month marked.',
  element: ui => ui.Svg({ source: (source ??= draw()), alt: 'Polar area chart of twelve months of API spend with the peak month marked, sample data', width: W, height: H }),
}
To use it in a mod: copy the file to your mod's hooks/designs/ and return its element(ui) from a pane's ui.render. How a pane is built.
Code: PolyForm Noncommercial License 1.0.0: noncommercial use only. Required Notice: Copyright 2026 Haruki Nakada (https://modscode.com).