ModsCode / Gallery / Designs / Calendar heatmap
Calendar heatmap
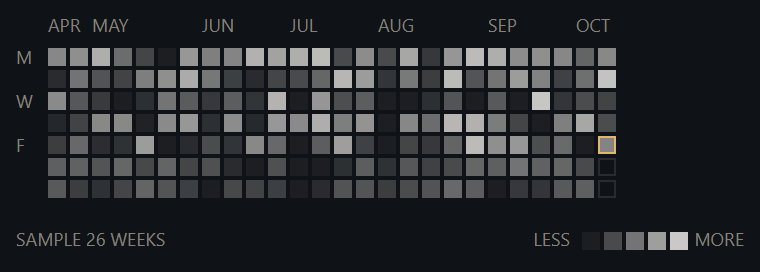
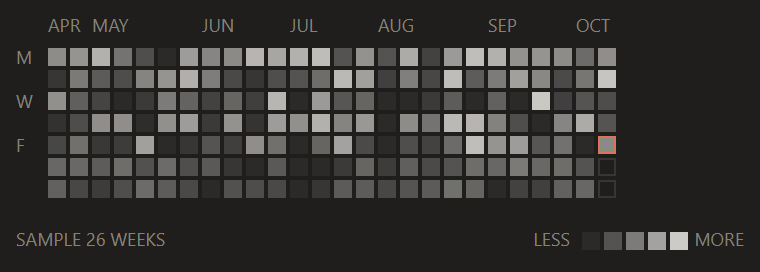
Calendar heatmap of 26 weeks by 7 days; idle days keep their place, today is the one Claude orange cell.
hooks/designs/heatmap.mjs
// heatmap: a calendar heatmap in candle's look, 26 weeks by 7 days with weeks as columns. Each cell
// is ink at an opacity from 0.06 to 0.85, so an idle day still keeps its place in the grid. The last
// cell is today (the only Claude orange on the sheet) and the days after it are hollow outlines. Sample data only.
const W = 380
const H = 136
const CELL = 9
const PITCH = 11 // a 9px cell and a 2px gap
const X0 = 24
const Y0 = 24
const WEEKS = 26
const TODAY = { week: 25, day: 4 } // the sample runs Mon 2026-04-13 to Sun 2026-10-11; day 4 is Fri 10-09
// The week that holds the 1st of each month (the sample opens in April)
const MONTHS = [[0, 'APR'], [2, 'MAY'], [7, 'JUN'], [11, 'JUL'], [15, 'AUG'], [20, 'SEP'], [24, 'OCT']]
const INK = '#141413'
const MUTED = '#73726C'
const CLAUDE = '#D77757'
const STAGE = '#FAF9F5'
const FONT = "'Inter Tight','Segoe UI',system-ui,sans-serif"

// The same ramp for the cells and the legend: 0.06 when idle, 0.85 when full
const ink = v => (0.06 + 0.79 * v).toFixed(2)

// A seeded calendar: weekdays busier than weekends, activity rising toward today, and some idle days
function sample() {
  let seed = 20261009
  const rnd = () => (seed = (Math.imul(seed, 1103515245) + 12345) & 0x7fffffff) / 0x7fffffff
  const weeks = []
  for (let w = 0; w < WEEKS; w++) {
    const days = []
    for (let d = 0; d < 7; d++) {
      const idle = rnd() < 0.12
      const busy = d < 5 ? 0.85 : 0.4
      days.push(idle ? 0 : Math.min(1, rnd() * busy + (0.15 * w) / (WEEKS - 1)))
    }
    weeks.push(days)
  }
  return weeks
}

function heatmapSource(weeks) {
  const label = (x, y, s, anchor = 'start') =>
    `<text x="${x}" y="${y}" text-anchor="${anchor}" font-size="9" font-family="${FONT}" fill="${MUTED}">${s}</text>`
  const parts = [`<rect width="${W}" height="${H}" rx="4" fill="${STAGE}"/>`]
  for (const [w, name] of MONTHS) parts.push(label(X0 + w * PITCH, Y0 - 8, name))
  for (const [d, name] of [[0, 'M'], [2, 'W'], [4, 'F']]) parts.push(label(8, Y0 + d * PITCH + 8, name))
  weeks.forEach((days, w) => {
    days.forEach((v, d) => {
      const x = X0 + w * PITCH
      const y = Y0 + d * PITCH
      if (w === TODAY.week && d > TODAY.day) {
        // No data yet: an outline keeps the slot without reading as a zero
        parts.push(`<rect x="${x + 0.5}" y="${y + 0.5}" width="8" height="8" fill="none" stroke="${INK}" stroke-opacity="0.12"/>`)
      } else {
        parts.push(`<rect x="${x}" y="${y}" width="${CELL}" height="${CELL}" fill="${INK}" fill-opacity="${ink(v)}"/>`)
      }
    })
  })
  parts.push(`<rect x="${X0 + TODAY.week * PITCH + 0.5}" y="${Y0 + TODAY.day * PITCH + 0.5}" width="8" height="8" fill="none" stroke="${CLAUDE}" stroke-width="1"/>`)
  // The legend uses the same ramp, read from idle to full
  const STEPS = [0, 0.25, 0.5, 0.75, 1]
  parts.push(label(285, 123, 'LESS', 'end'))
  STEPS.forEach((v, i) => parts.push(`<rect x="${291 + i * PITCH}" y="116" width="${CELL}" height="${CELL}" fill="${INK}" fill-opacity="${ink(v)}"/>`))
  parts.push(label(372, 123, 'MORE', 'end'))
  parts.push(label(8, 123, `SAMPLE ${WEEKS} WEEKS`))
  return `<svg xmlns="http://www.w3.org/2000/svg" viewBox="0 0 ${W} ${H}" width="${W}" height="${H}">${parts.join('')}</svg>`
}

const SOURCE = heatmapSource(sample())

export default {
  id: 'heatmap',
  title: 'Calendar heatmap',
  category: 'work',
  description: 'Calendar heatmap of 26 weeks by 7 days; idle days keep their place, today is the one Claude orange cell.',
  element: ui => ui.Svg({ source: SOURCE, alt: 'Calendar heatmap of 26 weeks of sample activity', width: W, height: H }),
}
To use it in a mod: copy the file to your mod's hooks/designs/ and return its element(ui) from a pane's ui.render. How a pane is built.
Code: PolyForm Noncommercial License 1.0.0: noncommercial use only. Required Notice: Copyright 2026 Haruki Nakada (https://modscode.com).