ModsCode / Gallery / Designs / Donut chart
Donut chart
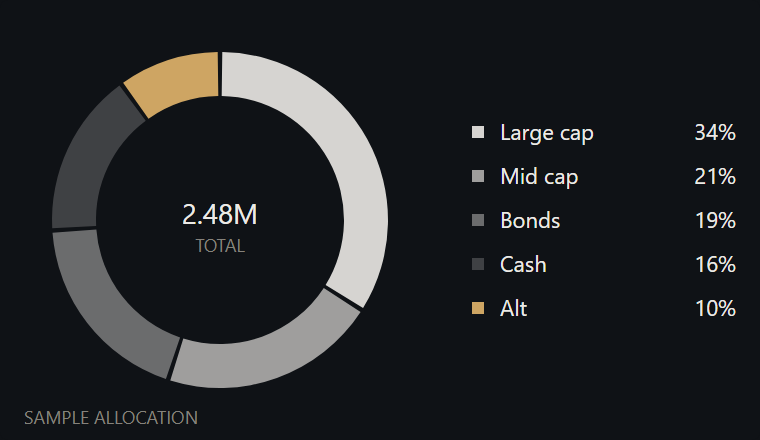
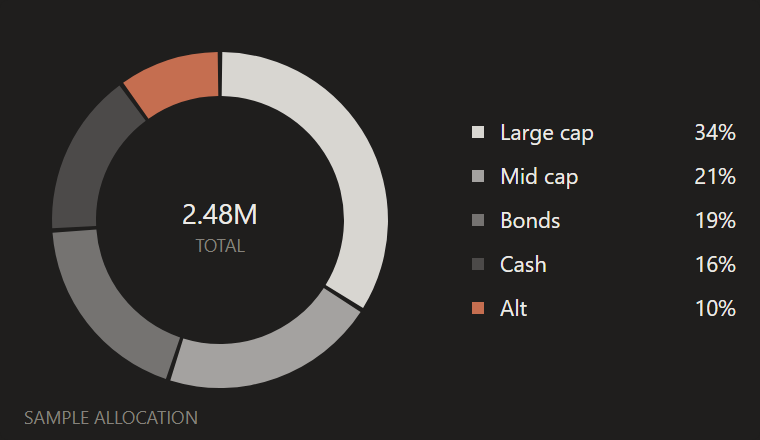
Allocation ring of five segments with even 2px gaps, the total in the centre and a legend with each share.
hooks/designs/donut.mjs
// donut: an allocation ring in candle's look. Five segments are arc paths with a 2px gap between
// neighbours, measured along the mid-radius, so the gap stays even as the ring curves. The total sits
// in the centre and a legend on the right carries each share. Fills are ink steps with one Claude orange
// accent, which keeps the palette to the candle set. Sample data only.
const W = 380
const H = 220
const STAGE = '#FAF9F5'
const INK = '#141413'
const MUTED = '#73726C'
const CLAUDE = '#D77757'
const FONT = "'Inter Tight','Segoe UI',system-ui,sans-serif"
const CX = 110
const CY = 110
const R_OUT = 84
const R_IN = 62
const R_MID = (R_OUT + R_IN) / 2
const GAP = 2 // px between two segments, along the mid-radius
const LX = 236 // legend left edge
const ROW = 22

// Shares in whole percent (they sum to 100), in ring order from the top
const SEGMENTS = [
  { name: 'Large cap', pct: 34, color: INK, opacity: 0.9 },
  { name: 'Mid cap', pct: 21, color: INK, opacity: 0.65 },
  { name: 'Bonds', pct: 19, color: INK, opacity: 0.42 },
  { name: 'Cash', pct: 16, color: INK, opacity: 0.22 },
  { name: 'Alt', pct: 10, color: CLAUDE, opacity: 0.9 },
]

const at = (r, a) => [CX + r * Math.cos(a), CY + r * Math.sin(a)]

// Half the gap comes off each end, so two neighbours are GAP apart on the mid-radius
function segPath(a0, a1) {
  const d = GAP / R_MID / 2
  const s = a0 + d
  const e = a1 - d
  const large = e - s > Math.PI ? 1 : 0
  const [xs, ys] = at(R_OUT, s)
  const [xe, ye] = at(R_OUT, e)
  const [xie, yie] = at(R_IN, e)
  const [xis, yis] = at(R_IN, s)
  return `M${xs.toFixed(2)} ${ys.toFixed(2)} A${R_OUT} ${R_OUT} 0 ${large} 1 ${xe.toFixed(2)} ${ye.toFixed(2)} L${xie.toFixed(2)} ${yie.toFixed(2)} A${R_IN} ${R_IN} 0 ${large} 0 ${xis.toFixed(2)} ${yis.toFixed(2)}Z`
}

function donutSource() {
  const parts = [`<rect width="${W}" height="${H}" rx="4" fill="${STAGE}"/>`]
  let a = -Math.PI / 2 // start at 12 o'clock and go clockwise
  for (const seg of SEGMENTS) {
    const a1 = a + (seg.pct / 100) * 2 * Math.PI
    parts.push(`<path d="${segPath(a, a1)}" fill="${seg.color}" fill-opacity="${seg.opacity}"/>`)
    a = a1
  }

  parts.push(`<text x="${CX}" y="${CY + 2}" text-anchor="middle" font-size="14" font-family="${FONT}" fill="${INK}">2.48M</text>`)
  parts.push(`<text x="${CX}" y="${CY + 16}" text-anchor="middle" font-size="9" font-family="${FONT}" fill="${MUTED}">TOTAL</text>`)

  const top = CY - ((SEGMENTS.length - 1) * ROW) / 2
  SEGMENTS.forEach((seg, i) => {
    const y = top + i * ROW
    parts.push(`<rect x="${LX}" y="${y - 3}" width="6" height="6" fill="${seg.color}" fill-opacity="${seg.opacity}"/>`)
    parts.push(`<text x="${LX + 14}" y="${y + 4}" font-size="11" font-family="${FONT}" fill="${INK}">${seg.name}</text>`)
    parts.push(`<text x="${W - 12}" y="${y + 4}" text-anchor="end" font-size="11" font-family="${FONT}" fill="${INK}">${seg.pct}%</text>`)
  })
  parts.push(`<text x="12" y="${H - 8}" font-size="9" font-family="${FONT}" fill="${MUTED}">SAMPLE ALLOCATION</text>`)
  return `<svg xmlns="http://www.w3.org/2000/svg" viewBox="0 0 ${W} ${H}" width="${W}" height="${H}">${parts.join('')}</svg>`
}

const SOURCE = donutSource()

export default {
  id: 'donut',
  title: 'Donut chart',
  category: 'parts',
  description: 'Allocation ring of five segments with even 2px gaps, the total in the centre and a legend with each share.',
  element: ui => ui.Svg({ source: SOURCE, alt: 'Allocation donut with five segments, total in the centre, legend with percentages, sample data', width: W, height: H }),
}
To use it in a mod: copy the file to your mod's hooks/designs/ and return its element(ui) from a pane's ui.render. How a pane is built.
Code: PolyForm Noncommercial License 1.0.0: noncommercial use only. Required Notice: Copyright 2026 Haruki Nakada (https://modscode.com).