ModsCode / Gallery / Designs / Waffle chart
Waffle chart
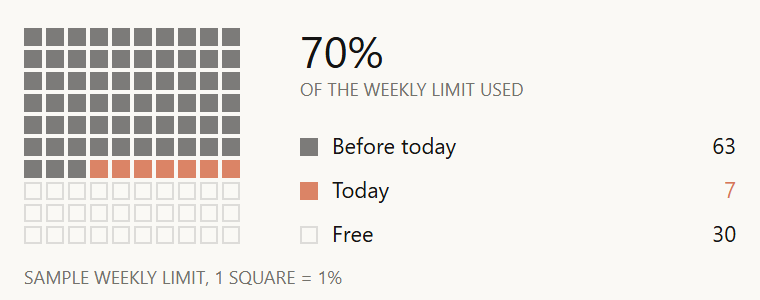
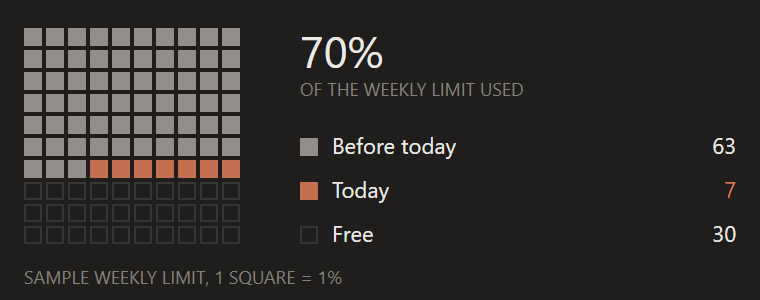
A 10 by 10 waffle of the weekly limit, one square per percent: used earlier, today in Claude orange, and free squares kept as outlines.
hooks/designs/waffle.mjs
// waffle: a 10 x 10 waffle of the weekly usage limit in candle's look, one square for each 1%. The
// squares fill row by row from the top left: 63 used before today (ink at candle's 55% body fill), then
// the 7 used today (the one Claude orange on the sheet), then 30 free as outlines at 12% ink, the same mark as
// heatmap's idle day, so they keep their place and still show in a thumbnail without reading as used.
// 63 + 7 + 30 = 100, so every count is also a percent. A square is 9px on an 11px pitch like heatmap's
// cells, and the legend rows sit on the grid's own rows. Sample data only.
const W = 380
const H = 150
const STAGE = '#FAF9F5'
const INK = '#141413'
const MUTED = '#73726C'
const CLAUDE = '#D77757'
const FONT = "'Inter Tight','Segoe UI',system-ui,sans-serif"
const CELL = 9
const PITCH = 11
const X0 = 12
const Y0 = 14
const LX = 150 // the legend's left edge
const f = n => n.toFixed(1)

const PARTS = [
  { name: 'Before today', count: 63, kind: 'used' },
  { name: 'Today', count: 7, kind: 'today' },
  { name: 'Free', count: 30, kind: 'free' },
]

const text = (x, y, s, { size = 9, fill = MUTED, anchor = 'start' } = {}) =>
  `<text x="${f(x)}" y="${f(y)}"${anchor === 'start' ? '' : ` text-anchor="${anchor}"`} font-size="${size}" font-family="${FONT}" fill="${fill}">${s}</text>`

// One square: a filled body for used and today, an outline on pixel centres for free
function square(x, y, kind) {
  if (kind === 'free') return `<rect x="${f(x + 0.5)}" y="${f(y + 0.5)}" width="8" height="8" fill="none" stroke="${INK}" stroke-opacity="0.12"/>`
  const fill = kind === 'today' ? `fill="${CLAUDE}" fill-opacity="0.9"` : `fill="${INK}" fill-opacity="0.55"`
  return `<rect x="${f(x)}" y="${f(y)}" width="${CELL}" height="${CELL}" ${fill}/>`
}

function draw() {
  const parts = [`<rect width="${W}" height="${H}" rx="4" fill="${STAGE}"/>`]
  const kinds = PARTS.flatMap(p => Array(p.count).fill(p.kind))
  kinds.forEach((kind, i) => parts.push(square(X0 + (i % 10) * PITCH, Y0 + Math.floor(i / 10) * PITCH, kind)))

  const used = PARTS[0].count + PARTS[1].count
  parts.push(text(LX, Y0 + 20, `${used}%`, { size: 22, fill: INK }))
  parts.push(text(LX, Y0 + 34, 'OF THE WEEKLY LIMIT USED'))
  // The legend rows sit on grid rows 5, 7 and 9, so they line up with the squares beside them
  PARTS.forEach((p, i) => {
    const y = Y0 + (5 + i * 2) * PITCH
    parts.push(square(LX, y, p.kind))
    parts.push(text(LX + 16, y + 8, p.name, { size: 11, fill: INK }))
    parts.push(text(W - 12, y + 8, String(p.count), { size: 11, fill: p.kind === 'today' ? CLAUDE : INK, anchor: 'end' }))
  })
  parts.push(text(12, H - 8, 'SAMPLE WEEKLY LIMIT, 1 SQUARE = 1%'))
  return `<svg xmlns="http://www.w3.org/2000/svg" viewBox="0 0 ${W} ${H}" width="${W}" height="${H}">${parts.join('')}</svg>`
}

let source // drawn on first use and kept: the pane loads every design, so none pays at load time
export default {
  id: 'waffle',
  title: 'Waffle chart',
  category: 'usage',
  description: 'A 10 by 10 waffle of the weekly limit, one square per percent: used earlier, today in Claude orange, and free squares kept as outlines.',
  element: ui => ui.Svg({ source: (source ??= draw()), alt: 'Waffle chart of the weekly usage limit: 63 squares used before today, 7 today and 30 free, sample data', width: W, height: H }),
}
To use it in a mod: copy the file to your mod's hooks/designs/ and return its element(ui) from a pane's ui.render. How a pane is built.
Code: PolyForm Noncommercial License 1.0.0: noncommercial use only. Required Notice: Copyright 2026 Haruki Nakada (https://modscode.com).