ModsCode / Gallery / Designs / Streamgraph
Streamgraph
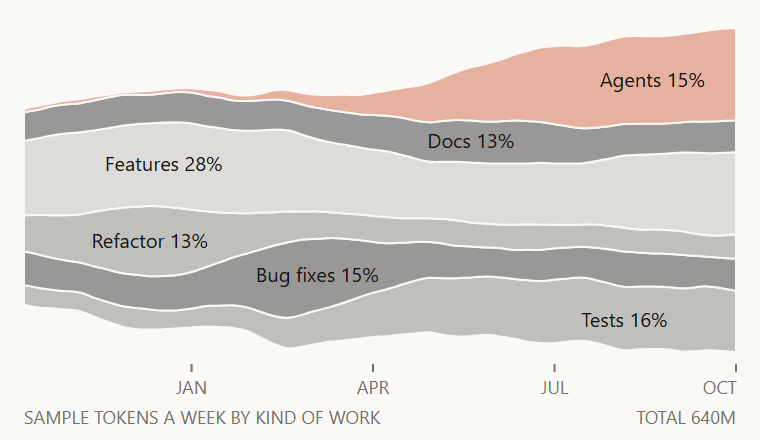
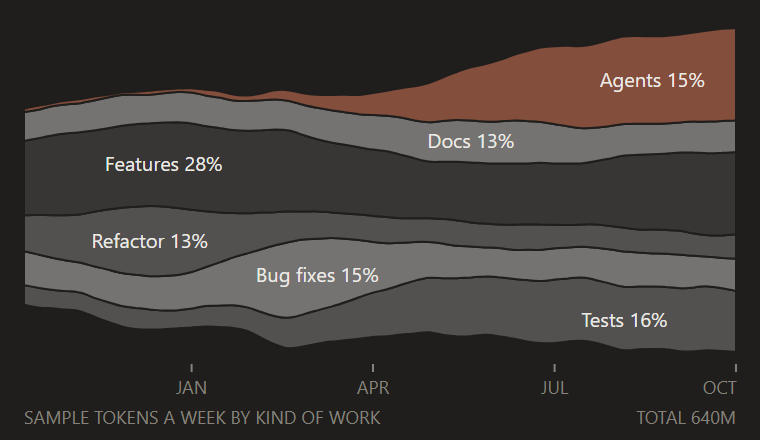
Tokens a week by kind of work over a year as flowing streams around a moving centre line, each named inside its widest part.
hooks/designs/streamgraph.mjs
// streamgraph: tokens a week by kind of work over the last 52 weeks (Mon 2025-10-13 to Mon 2026-10-05),
// six streams in candle's look. The layers come from d3-shape's stack() with stackOffsetWiggle (the
// baseline moves to keep the streams' slopes small) and stackOrderInsideOut (the biggest streams sit in
// the middle), drawn with curveBasis; all three are d3-shape (ISC, Mike Bostock), after Byron and
// Wattenberg's "Stacked Graphs" (2008). The five ink streams share three quiet steps
// (0.12 / 0.25 / 0.42, the biggest stream dimmest) and the one Claude orange stream takes 0.55, so it
// stays the brightest area: 0.22 / 0.42 / 0.65 with Claude orange at 0.9 was tried and the streams, which fill
// most of the stage, outshouted candle as flat blocks. Neighbours never share a step, a 1px stage line
// splits them, and every stream carries its name and share inside its widest part, so no
// legend is needed. The sample weeks are seeded (20261020), in millions of tokens: features steady near
// 3.4, a bug-fix spike around the start of March, a refactor in December, tests rising from April, docs
// steady near 1.5, and agents (the Claude orange stream) rising from under 0.2 in May to the largest stream by
// October. Sample data only.
import { stack, area, stackOffsetWiggle, stackOrderInsideOut, curveBasis } from '../vendor/d3.mjs'

const W = 380
const H = 220
const STAGE = '#FAF9F5'
const INK = '#141413'
const MUTED = '#73726C'
const CLAUDE = '#D77757'
const FONT = "'Inter Tight','Segoe UI',system-ui,sans-serif"
const PLOT = { left: 12, right: 368, top: 14, bottom: 176 }
const N = 52
const STEPS = [0.12, 0.25, 0.42] // quiet steps for the ink streams; the accent stream takes 0.55, the brightest
const TOPICS = [
  { key: 'features', name: 'Features' },
  { key: 'bugs', name: 'Bug fixes' },
  { key: 'tests', name: 'Tests' },
  { key: 'refactor', name: 'Refactor' },
  { key: 'docs', name: 'Docs' },
  { key: 'agents', name: 'Agents', accent: true },
]
// The Monday that opens each month's first full week: Jan 5, Apr 6, Jul 6, Oct 5
const MONTHS = [[12, 'JAN'], [25, 'APR'], [38, 'JUL'], [51, 'OCT']]
const f = n => n.toFixed(1)

function rng(seed) {
  return () => (seed = (Math.imul(seed, 1103515245) + 12345) & 0x7fffffff) / 0x7fffffff
}

const text = (x, y, s, { size = 9, fill = MUTED, anchor = 'start', font = FONT } = {}) =>
  `<text x="${f(x)}" y="${f(y)}"${anchor === 'start' ? '' : ` text-anchor="${anchor}"`} font-size="${size}" font-family="${font}" fill="${fill}">${s}</text>`

const bump = (t, at, width) => Math.exp(-(((t - at) / width) ** 2) / 2)
const rise = (t, at, width) => 1 / (1 + Math.exp(-(t - at) / width))

// Seeded weeks in millions of tokens, smoothed over three weeks so the streams flow
function sample() {
  const rnd = rng(20261020)
  const raw = []
  for (let t = 0; t < N; t++) {
    const n = () => (rnd() - 0.5) * 0.5
    raw.push({
      features: 3.4 + 0.7 * Math.sin(t / 7) + n(),
      bugs: 1.5 + 2.2 * bump(t, 20, 3.5) + n(),
      tests: 0.9 + 2.0 * rise(t, 24, 4) + n(),
      refactor: 1.1 + 2.2 * bump(t, 9, 5) + n(),
      docs: 1.4 + 0.6 * bump(t, 33, 6) + n() * 0.6,
      agents: 0.15 + 4.2 * rise(t, 31, 4.5) + n() * 0.6,
    })
  }
  return raw.map((_, t) => {
    const out = {}
    for (const { key } of TOPICS) {
      const win = [t - 1, t, t + 1].filter(i => i >= 0 && i < N)
      out[key] = Math.max(0.1, win.reduce((s, i) => s + raw[i][key], 0) / win.length)
    }
    return out
  })
}

function draw() {
  const weeks = sample()
  const layers = stack().keys(TOPICS.map(t => t.key)).offset(stackOffsetWiggle).order(stackOrderInsideOut)(weeks)
  const lo = Math.min(...layers.flatMap(l => l.map(p => p[0])))
  const hi = Math.max(...layers.flatMap(l => l.map(p => p[1])))
  const x = i => PLOT.left + ((PLOT.right - PLOT.left) * i) / (N - 1)
  const y = v => PLOT.bottom - ((v - lo) / (hi - lo)) * (PLOT.bottom - PLOT.top)
  const shape = area().x((p, i) => x(i)).y0(p => y(p[0])).y1(p => y(p[1])).curve(curveBasis).digits(1)
  const parts = [`<rect width="${W}" height="${H}" rx="4" fill="${STAGE}"/>`]

  // The biggest stream takes the dimmest step, so the large areas stay quiet; after that each stream
  // takes the least used step its neighbours do not have, so no two neighbours ever match
  const byPos = [...layers].sort((a, b) => a.index - b.index)
  const sizeOf = layer => layer.reduce((sum, p) => sum + p[1] - p[0], 0)
  const look = new Map()
  const accent = TOPICS.find(t => t.accent).key
  look.set(accent, { fill: CLAUDE, opacity: 0.55 })
  for (const layer of [...byPos].filter(l => l.key !== accent).sort((a, b) => sizeOf(b) - sizeOf(a))) {
    const near = [byPos[layer.index - 1], byPos[layer.index + 1]].map(l => l && look.get(l.key)?.opacity)
    const uses = o => [...look.values()].filter(v => v.opacity === o).length
    const free = STEPS.filter(o => !near.includes(o)).sort((a, b) => uses(a) - uses(b) || a - b)
    look.set(layer.key, { fill: INK, opacity: free[0] })
  }
  for (const layer of byPos) {
    const { fill, opacity } = look.get(layer.key)
    parts.push(`<path d="${shape(layer)}" fill="${fill}" fill-opacity="${opacity}" stroke="${STAGE}" stroke-width="1"/>`)
  }

  // Each name goes where its stream stays thickest across the whole label, or is left off
  const total = weeks.reduce((sum, w) => sum + TOPICS.reduce((a, t) => a + w[t.key], 0), 0)
  const step = (PLOT.right - PLOT.left) / (N - 1)
  for (const layer of byPos) {
    const topic = TOPICS.find(t => t.key === layer.key)
    const share = Math.round((100 * weeks.reduce((sum, w) => sum + w[layer.key], 0)) / total)
    const thick = i => y(layer[i][0]) - y(layer[i][1])
    let best = null
    for (const label of [`${topic.name} ${share}%`, topic.name]) {
      const half = Math.ceil((label.length * 5.6 * 1.1) / 2 / step) + 1
      for (let i = half; i < N - half; i++) {
        let min = Infinity
        for (let j = i - half; j <= i + half; j++) min = Math.min(min, thick(j))
        if (min >= 14 && (!best || min > best.min)) best = { i, min, label }
      }
      if (best) break
    }
    if (!best) continue
    const mid = (y(layer[best.i][0]) + y(layer[best.i][1])) / 2
    // Ink on every stream: no step is above 0.55, where stage-coloured text would lose contrast
    parts.push(text(x(best.i), mid + 3.5, best.label, { size: 10, fill: INK, anchor: 'middle' }))
  }

  for (const [i, name] of MONTHS) {
    const tx = x(i)
    parts.push(`<line x1="${f(tx)}" x2="${f(tx)}" y1="${PLOT.bottom + 6}" y2="${PLOT.bottom + 10}" stroke="${MUTED}" stroke-width="1"/>`)
    parts.push(text(i === N - 1 ? tx + 0.5 : tx, PLOT.bottom + 21, name, { anchor: i === N - 1 ? 'end' : 'middle' }))
  }
  parts.push(text(W - 12, H - 8, `TOTAL ${Math.round(total)}M`, { anchor: 'end' }))
  parts.push(text(12, H - 8, 'SAMPLE TOKENS A WEEK BY KIND OF WORK'))
  return `<svg xmlns="http://www.w3.org/2000/svg" viewBox="0 0 ${W} ${H}" width="${W}" height="${H}">${parts.join('')}</svg>`
}

let source // drawn on first use and kept: the pane loads every design, so none pays at load time
export default {
  id: 'streamgraph',
  title: 'Streamgraph',
  category: 'time',
  description: 'Tokens a week by kind of work over a year as flowing streams around a moving centre line, each named inside its widest part.',
  element: ui => ui.Svg({ source: (source ??= draw()), alt: 'Streamgraph of tokens a week across six kinds of work over 52 weeks, agents rising in Claude orange, sample data', width: W, height: H }),
}
Imports d3-shape 3.2.0 (ISC), bundled with its licence in look's hooks/vendor/.
To use it in a mod: copy the file to your mod's hooks/designs/ and return its element(ui) from a pane's ui.render. How a pane is built.
Code: PolyForm Noncommercial License 1.0.0: noncommercial use only. Required Notice: Copyright 2026 Haruki Nakada (https://modscode.com).