ModsCode / Gallery / Designs / Radar chart
Radar chart
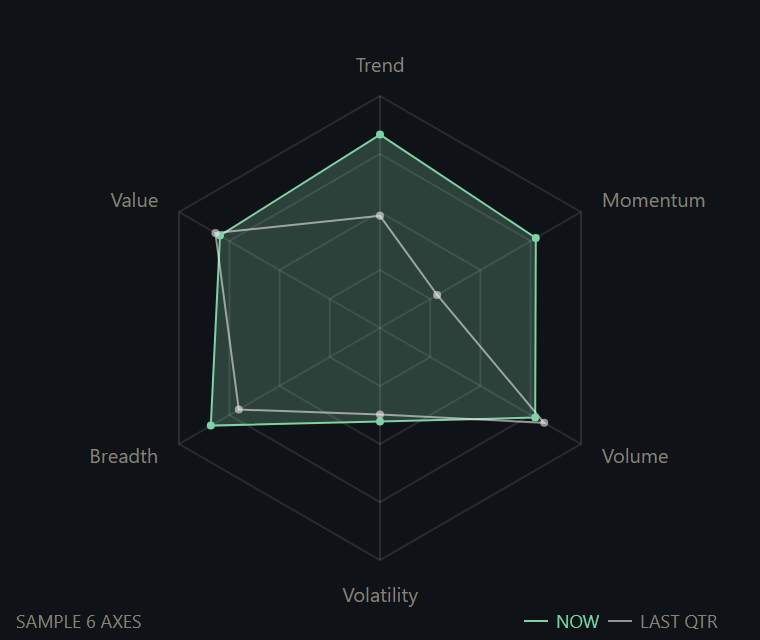
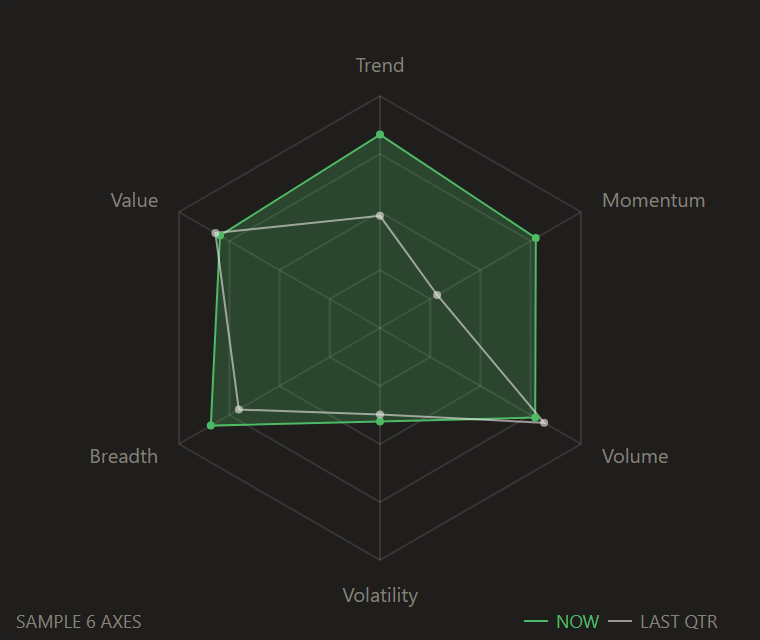
Six axes with two series, the newer one filled, with a dot on each vertex so single values can be read.
hooks/designs/radar.mjs
// radar: six axes in candle's look, with four 1px rings and six spokes at 12% ink. The newer series is an
// up-green fill at 25% with an up stroke; the older one is an ink line at 60%. Each vertex has a dot so a
// single value can be read off the chart. Axis names sit just outside the outer ring. Sample data only.
const W = 380
const H = 320
const CX = 190
const CY = 164
const R = 116
const AXES = ['Trend', 'Momentum', 'Volume', 'Volatility', 'Breadth', 'Value']
const UP = '#2C7A39'
const INK = '#141413'
const MUTED = '#73726C'
const STAGE = '#FAF9F5'
const FONT = "'Inter Tight','Segoe UI',system-ui,sans-serif"

// A seeded pair of readings per axis, as fractions of the outer ring
function sample() {
  let seed = 20261009
  const rnd = () => (seed = (Math.imul(seed, 1103515245) + 12345) & 0x7fffffff) / 0x7fffffff
  const now = AXES.map(() => 0.35 + rnd() * 0.6)
  const last = AXES.map(() => 0.25 + rnd() * 0.6)
  return { now, last }
}

// Axis 0 points up and the rest run clockwise, so the first name sits at twelve o'clock
const angle = k => -Math.PI / 2 + (k * Math.PI) / 3
const f = n => n.toFixed(1)
const at = (k, r) => [CX + r * Math.cos(angle(k)), CY + r * Math.sin(angle(k))]
const shape = radii => radii.map((r, k) => at(k, r).map(f).join(',')).join(' ')
const text = (x, y, s, anchor, size, fill) =>
  `<text x="${f(x)}" y="${f(y)}" text-anchor="${anchor}" font-size="${size}" font-family="${FONT}" fill="${fill}">${s}</text>`
const dot = (x, y, fill, opacity) => `<circle cx="${f(x)}" cy="${f(y)}" r="2" fill="${fill}" fill-opacity="${opacity}"/>`

function radarSource({ now, last }) {
  const parts = [`<rect width="${W}" height="${H}" rx="4" fill="${STAGE}"/>`]
  for (const share of [0.25, 0.5, 0.75, 1]) {
    parts.push(`<polygon points="${shape(AXES.map(() => R * share))}" fill="none" stroke="${INK}" stroke-opacity="0.12" stroke-width="1"/>`)
  }
  AXES.forEach((_, k) => {
    const [x, y] = at(k, R)
    parts.push(`<line x1="${CX}" y1="${CY}" x2="${f(x)}" y2="${f(y)}" stroke="${INK}" stroke-opacity="0.12" stroke-width="1"/>`)
  })
  const nowR = now.map(v => v * R)
  const lastR = last.map(v => v * R)
  parts.push(`<polygon points="${shape(nowR)}" fill="${UP}" fill-opacity="0.25" stroke="${UP}" stroke-width="1"/>`)
  parts.push(`<polygon points="${shape(lastR)}" fill="none" stroke="${INK}" stroke-opacity="0.6" stroke-width="1"/>`)
  nowR.forEach((r, k) => {
    const [x, y] = at(k, r)
    parts.push(dot(x, y, UP, 1))
  })
  lastR.forEach((r, k) => {
    const [x, y] = at(k, r)
    parts.push(dot(x, y, INK, 0.6))
  })
  AXES.forEach((name, k) => {
    const c = Math.cos(angle(k))
    const s = Math.sin(angle(k))
    const [x, y] = at(k, R + 12)
    // Names at twelve and six o'clock sit above or below their tip; the side names are centred on it
    const anchor = c > 0.2 ? 'start' : c < -0.2 ? 'end' : 'middle'
    const dy = s < -0.9 ? 0 : s > 0.9 ? 9 : 3.5
    parts.push(text(x, y + dy, name, anchor, 10, MUTED))
  })
  parts.push(text(8, 314, 'SAMPLE 6 AXES', 'start', 9, MUTED))
  parts.push(`<line x1="262" y1="310.5" x2="274" y2="310.5" stroke="${UP}" stroke-width="1"/>`)
  parts.push(text(278, 314, 'NOW', 'start', 9, UP))
  parts.push(`<line x1="304" y1="310.5" x2="316" y2="310.5" stroke="${INK}" stroke-opacity="0.6" stroke-width="1"/>`)
  parts.push(text(320, 314, 'LAST QTR', 'start', 9, MUTED))
  return `<svg xmlns="http://www.w3.org/2000/svg" viewBox="0 0 ${W} ${H}" width="${W}" height="${H}">${parts.join('')}</svg>`
}

const SOURCE = radarSource(sample())

export default {
  id: 'radar',
  title: 'Radar chart',
  category: 'compare',
  description: 'Six axes with two series, the newer one filled, with a dot on each vertex so single values can be read.',
  element: ui => ui.Svg({ source: SOURCE, alt: 'Radar chart of six axes with two sample series', width: W, height: H }),
}
To use it in a mod: copy the file to your mod's hooks/designs/ and return its element(ui) from a pane's ui.render. How a pane is built.
Code: PolyForm Noncommercial License 1.0.0: noncommercial use only. Required Notice: Copyright 2026 Haruki Nakada (https://modscode.com).