ModsCode / Gallery / Designs / Multi-line chart
Multi-line chart
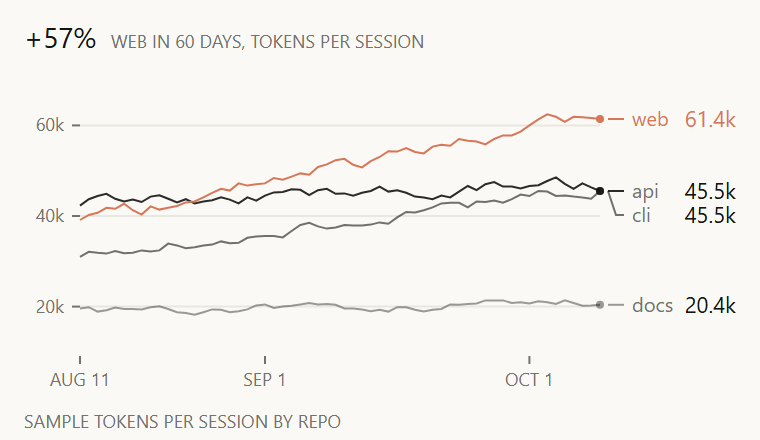
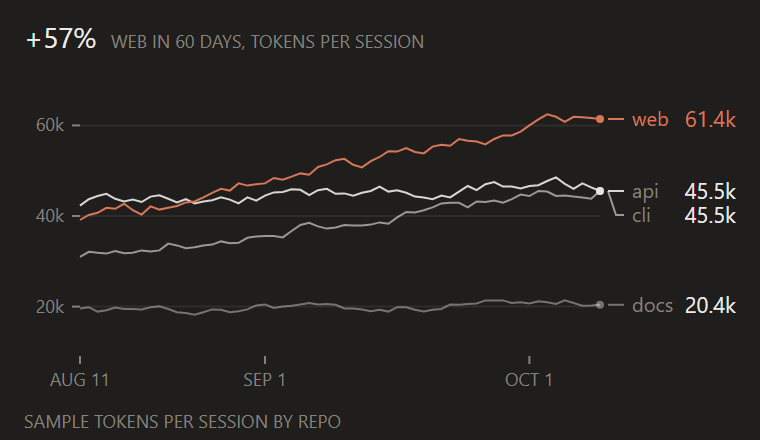
Several series as thin lines, the one to notice in Claude orange, with end labels pushed apart so close finishes stay readable.
hooks/designs/multi-line.mjs
// multi-line: median tokens per Claude Code session in four repos over 60 days (Tue 2026-08-11 to Fri
// 2026-10-09), in candle's look. web is the one to notice and the only Claude orange: it climbs from 39.1k to
// 61.4k (+57%, the hero, computed from its first and last points) and stays above api from Aug 24. The
// other three are 1px ink lines at 0.9 / 0.6 / 0.42 so they recede behind it. api and cli both finish
// at 45.5k, which is the case the end labels exist for: label centres are pushed at least 12px apart
// (an 11px value and a pixel of air) by a hand-written two-pass dodge, and a short leader in each line's
// own ink joins the dot at the line end to its label. The scale runs 10k to 70k with hairlines at 20k,
// 40k and 60k. No open-source code. Sample data only.
const W = 380
const H = 220
const STAGE = '#FAF9F5'
const INK = '#141413'
const MUTED = '#73726C'
const CLAUDE = '#D77757'
const FONT = "'Inter Tight','Segoe UI',system-ui,sans-serif"
const PLOT = { left: 40, right: 300, top: 40, bottom: 176 }
const N = 60 // days, Tue 2026-08-11 to Fri 2026-10-09
const LO = 10 // thousand tokens at the plot bottom
const HI = 70 // and at the top
const GAP = 12 // the least distance between two end labels: an 11px value and a pixel of air
const f = n => n.toFixed(1)
// Estimated text width: m, w and % run wide, spaces and dots narrow, the rest about 0.56 em
const wide = (s, size) => [...s].reduce((w, c) => w + size * (/[mwMW%]/.test(c) ? 0.85 : /[ .,:il1]/.test(c) ? 0.3 : 0.56), 0)

// A seeded walk, so the picture is the same on every render
function rng(seed) {
  return () => (seed = (Math.imul(seed, 1103515245) + 12345) & 0x7fffffff) / 0x7fffffff
}

const text = (x, y, s, { size = 9, fill = MUTED, anchor = 'start' } = {}) =>
  `<text x="${f(x)}" y="${f(y)}"${anchor === 'start' ? '' : ` text-anchor="${anchor}"`} font-size="${size}" font-family="${FONT}" fill="${fill}">${s}</text>`

// Median tokens per session (thousands) by repo. web is the one to notice: its sessions keep growing
const SERIES = [
  { name: 'web', from: 38, to: 63, wobble: 2.6, color: CLAUDE, opacity: 1 },
  { name: 'api', from: 43, to: 47, wobble: 2.2, color: INK, opacity: 0.9 },
  { name: 'cli', from: 31, to: 46, wobble: 2.0, color: INK, opacity: 0.6 },
  { name: 'docs', from: 19, to: 21, wobble: 1.6, color: INK, opacity: 0.42 },
]

// A straight trend from `from` to `to` with a smoothed seeded wobble on top
function sample() {
  const rnd = rng(20261017)
  return SERIES.map(s => {
    let w = 0
    const out = []
    for (let i = 0; i < N; i++) {
      w = 0.7 * w + (rnd() - 0.5) * s.wobble
      out.push(Math.round((s.from + ((s.to - s.from) * i) / (N - 1) + w) * 10) / 10)
    }
    return out
  })
}

// Pushes label centres at least `gap` apart inside [lo, hi], keeping their order
function dodge(ys, gap, lo, hi) {
  const order = ys.map((y, i) => [y, i]).sort((a, b) => a[0] - b[0])
  const out = order.map(([y]) => y)
  for (let i = 1; i < out.length; i++) out[i] = Math.max(out[i], out[i - 1] + gap)
  if (out[out.length - 1] > hi) out[out.length - 1] = hi
  for (let i = out.length - 2; i >= 0; i--) out[i] = Math.min(out[i], out[i + 1] - gap)
  if (out[0] < lo) for (let i = 0; i < out.length; i++) out[i] = Math.max(out[i], lo + i * gap)
  const placed = []
  order.forEach(([, idx], k) => (placed[idx] = out[k]))
  return placed
}

function draw() {
  const data = sample()
  const x = i => PLOT.left + ((PLOT.right - PLOT.left) * i) / (N - 1)
  const y = v => PLOT.bottom - ((PLOT.bottom - PLOT.top) * (v - LO)) / (HI - LO)
  const parts = [`<rect width="${W}" height="${H}" rx="4" fill="${STAGE}"/>`]

  // Header: how far the Claude orange series moved over the window
  const web = data[0]
  const change = Math.round((web[N - 1] / web[0] - 1) * 100)
  const hero = `${change > 0 ? '+' : ''}${change}%`
  parts.push(text(12, 24, hero, { size: 14, fill: INK }))
  parts.push(text(12 + wide(hero, 14) + 8, 24, `${SERIES[0].name.toUpperCase()} IN ${N} DAYS, TOKENS PER SESSION`))

  // Left scale: 4px stubs and faint hairlines, no axis line
  for (const v of [20, 40, 60]) {
    parts.push(`<line x1="${PLOT.left}" x2="${PLOT.right}" y1="${f(y(v))}" y2="${f(y(v))}" stroke="${INK}" stroke-opacity="0.08"/>`)
    parts.push(`<line x1="${PLOT.left - 4}" x2="${PLOT.left}" y1="${f(y(v))}" y2="${f(y(v))}" stroke="${MUTED}" stroke-width="1"/>`)
    parts.push(text(PLOT.left - 8, y(v) + 3, `${v}k`, { anchor: 'end' }))
  }

  // Lines back to front, so the Claude orange one is drawn last and stays on top where they cross
  for (let k = SERIES.length - 1; k >= 0; k--) {
    const s = SERIES[k]
    const pts = data[k].map((v, i) => `${f(x(i))},${f(y(v))}`).join(' ')
    parts.push(`<polyline points="${pts}" fill="none" stroke="${s.color}"${s.opacity < 1 ? ` stroke-opacity="${s.opacity}"` : ''} stroke-width="1"/>`)
  }

  // End labels: dodged apart, each joined to its line end by a short leader in the line's own ink
  const ends = data.map(d => y(d[N - 1]))
  const ys = dodge(ends, GAP, PLOT.top, PLOT.bottom)
  SERIES.forEach((s, k) => {
    const op = s.opacity < 1 ? ` stroke-opacity="${s.opacity}"` : ''
    parts.push(`<circle cx="${f(x(N - 1))}" cy="${f(ends[k])}" r="2" fill="${s.color}"${s.opacity < 1 ? ` fill-opacity="${s.opacity}"` : ''}/>`)
    parts.push(`<path d="M${f(PLOT.right + 4)} ${f(ends[k])} L${f(PLOT.right + 8)} ${f(ys[k])} H${f(PLOT.right + 12)}" fill="none" stroke="${s.color}"${op} stroke-width="1"/>`)
    parts.push(text(PLOT.right + 16, ys[k] + 3.5, s.name, { size: 10, fill: s.color === CLAUDE ? CLAUDE : MUTED }))
    parts.push(text(W - 12, ys[k] + 4, `${data[k][N - 1].toFixed(1)}k`, { size: 11, fill: s.color === CLAUDE ? CLAUDE : INK, anchor: 'end' }))
  })

  // Date ticks: the first day and each month start
  for (const [i, label] of [[0, 'AUG 11'], [21, 'SEP 1'], [51, 'OCT 1']]) {
    parts.push(`<line x1="${f(x(i))}" x2="${f(x(i))}" y1="${PLOT.bottom + 2}" y2="${PLOT.bottom + 6}" stroke="${MUTED}" stroke-width="1"/>`)
    parts.push(text(x(i), PLOT.bottom + 17, label, { anchor: 'middle' }))
  }
  parts.push(text(12, H - 6, 'SAMPLE TOKENS PER SESSION BY REPO'))
  return `<svg xmlns="http://www.w3.org/2000/svg" viewBox="0 0 ${W} ${H}" width="${W}" height="${H}">${parts.join('')}</svg>`
}

let source // drawn on first use and kept: the pane loads every design, so none pays at load time
export default {
  id: 'multi-line',
  title: 'Multi-line chart',
  category: 'time',
  description: 'Several series as thin lines, the one to notice in Claude orange, with end labels pushed apart so close finishes stay readable.',
  element: ui => ui.Svg({ source: (source ??= draw()), alt: 'Line chart of tokens per session for several repos, one highlighted in Claude orange, each labelled with its last value at the right, sample data', width: W, height: H }),
}
To use it in a mod: copy the file to your mod's hooks/designs/ and return its element(ui) from a pane's ui.render. How a pane is built.
Code: PolyForm Noncommercial License 1.0.0: noncommercial use only. Required Notice: Copyright 2026 Haruki Nakada (https://modscode.com).