ModsCode / Gallery / Designs / Gauges
Gauges
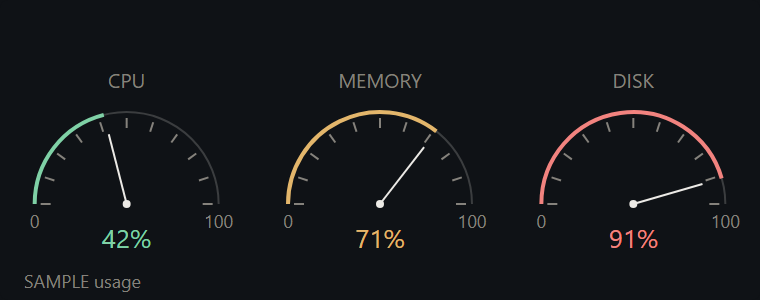
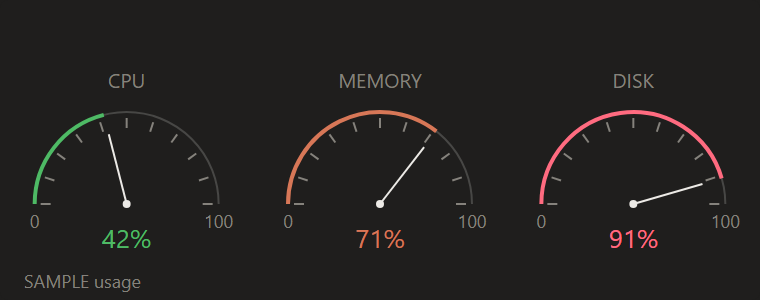
Three semicircular dials with ticks every 10%, coloured by threshold so the state reads before the number.
hooks/designs/gauge.mjs
// gauge: three semicircular dials in a row in candle's look. Ticks every 10%, a needle, a label
// above and the value under each. The colour follows a threshold (up below 60%, Claude orange to 85%, down
// above), so the state reads before the number does. The value arc is 2px so the colour carries; every
// other stroke is 1px. Sample data only.
const W = 380
const H = 150
const STAGE = '#FAF9F5'
const UP = '#2C7A39'
const DOWN = '#AB2B3F'
const CLAUDE = '#D77757'
const INK = '#141413'
const MUTED = '#73726C'
const FONT = "'Inter Tight','Segoe UI',system-ui,sans-serif"
const R = 46
const CY = 102
const CELL = W / 3

const DIALS = [
  { label: 'CPU', value: 0.42 },
  { label: 'MEMORY', value: 0.71 },
  { label: 'DISK', value: 0.91 },
]

// Fraction 0 is the left end, 1 the right end; the arc runs over the top, clockwise on screen
const at = (cx, r, f) => {
  const t = Math.PI * (1 - f)
  return [cx + r * Math.cos(t), CY - r * Math.sin(t)]
}
const pt = (cx, r, f) => at(cx, r, f).map(n => n.toFixed(2)).join(' ')

const colorFor = v => (v < 0.6 ? UP : v <= 0.85 ? CLAUDE : DOWN)

function dial(d, i) {
  const cx = CELL / 2 + i * CELL
  const v = d.value
  const color = colorFor(v)
  const parts = [
    `<text x="${cx}" y="${CY - R - 12}" text-anchor="middle" font-size="10" font-family="${FONT}" fill="${MUTED}">${d.label}</text>`,
    `<path d="M${pt(cx, R, 0)} A${R} ${R} 0 0 1 ${pt(cx, R, 1)}" fill="none" stroke="${INK}" stroke-opacity="0.2" stroke-width="1"/>`,
  ]
  for (let k = 0; k <= 10; k++) {
    const [x1, y1] = at(cx, R - 8, k / 10)
    const [x2, y2] = at(cx, R - 3, k / 10)
    parts.push(`<line x1="${x1.toFixed(2)}" y1="${y1.toFixed(2)}" x2="${x2.toFixed(2)}" y2="${y2.toFixed(2)}" stroke="${MUTED}" stroke-width="1"/>`)
  }
  parts.push(`<path d="M${pt(cx, R, 0)} A${R} ${R} 0 0 1 ${pt(cx, R, v)}" fill="none" stroke="${color}" stroke-width="2"/>`)
  const [nx, ny] = at(cx, R - 10, v)
  parts.push(`<line x1="${cx}" y1="${CY}" x2="${nx.toFixed(2)}" y2="${ny.toFixed(2)}" stroke="${INK}" stroke-width="1"/>`)
  parts.push(`<circle cx="${cx}" cy="${CY}" r="2" fill="${INK}"/>`)
  parts.push(`<text x="${cx - R}" y="${CY + 12}" text-anchor="middle" font-size="9" font-family="${FONT}" fill="${MUTED}">0</text>`)
  parts.push(`<text x="${cx + R}" y="${CY + 12}" text-anchor="middle" font-size="9" font-family="${FONT}" fill="${MUTED}">100</text>`)
  parts.push(`<text x="${cx}" y="${CY + 22}" text-anchor="middle" font-size="13" font-family="${FONT}" fill="${color}">${Math.round(v * 100)}%</text>`)
  return parts.join('')
}

const SOURCE = `<svg xmlns="http://www.w3.org/2000/svg" viewBox="0 0 ${W} ${H}" width="${W}" height="${H}"><rect width="${W}" height="${H}" rx="4" fill="${STAGE}"/>${DIALS.map(dial).join('')}<text x="12" y="${H - 6}" font-size="9" font-family="${FONT}" fill="${MUTED}">SAMPLE usage</text></svg>`

export default {
  id: 'gauge',
  title: 'Gauges',
  category: 'usage',
  description: 'Three semicircular dials with ticks every 10%, coloured by threshold so the state reads before the number.',
  element: ui => ui.Svg({ source: SOURCE, alt: 'Three semicircular gauges with ticks every 10 percent, coloured by threshold, sample data', width: W, height: H }),
}
To use it in a mod: copy the file to your mod's hooks/designs/ and return its element(ui) from a pane's ui.render. How a pane is built.
Code: PolyForm Noncommercial License 1.0.0: noncommercial use only. Required Notice: Copyright 2026 Haruki Nakada (https://modscode.com).