ModsCode / Gallery / Designs / Funnel chart
Funnel chart
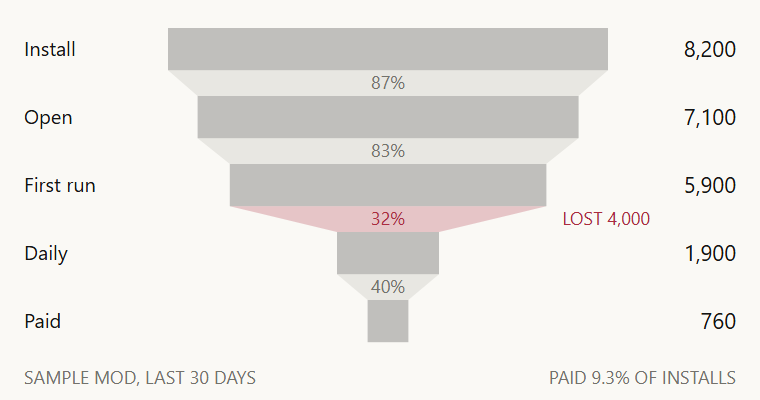
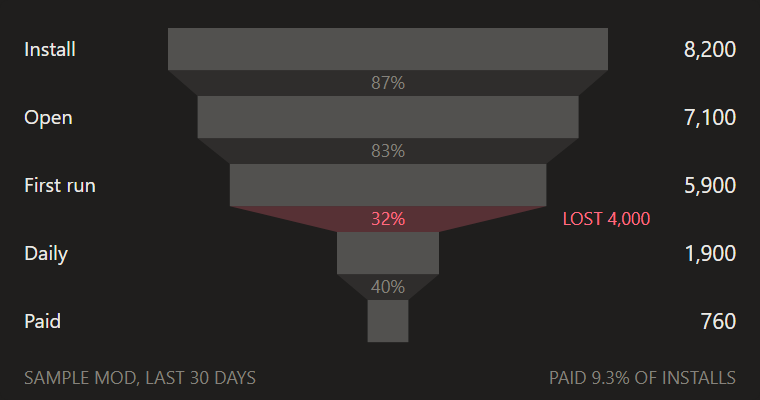
Five centred bars from install to paid with the conversion of each step between them; the step that loses the most people is drawn in red.
hooks/designs/funnel.mjs
// funnel: a mod's last 30 days from install to paid as five centred bars in candle's look. Each bar's
// width is its count over the installs, on one scale; the bar takes 62% of its row (candle's slot) at
// 25% ink, the area-fill rung rather than a body's 55%, because five wide ink slabs at 55% outweigh
// every other picture on the sheet. The other 38% holds a faint trapezoid (ink 0.08) that joins a bar
// to the next, with the step's conversion written on it. The step that loses the most people, by share
// and by count, is the one drawn in DOWN: first run to daily keeps 32% and loses 4,000. The sample
// numbers are chosen, not seeded: 8,200 installs, 7,100 opened the pane (87%), 5,900 ran it once (83%),
// 1,900 use it daily (32%) and 760 pay (40%), so 9.3% of installs pay. Sample data only.
const W = 380
const H = 200
const STAGE = '#FAF9F5'
const INK = '#141413'
const MUTED = '#73726C'
const DOWN = '#AB2B3F'
const FONT = "'Inter Tight','Segoe UI',system-ui,sans-serif"
const BAND = { left: 84, right: 304 } // the widest bar fills this band; every bar is centred in it
const CX = (BAND.left + BAND.right) / 2
const TOP = 14
const SLOT = 34
const BAR = SLOT * 0.62
const STEPS = [
  { name: 'Install', n: 8200 },
  { name: 'Open', n: 7100 },
  { name: 'First run', n: 5900 },
  { name: 'Daily', n: 1900 },
  { name: 'Paid', n: 760 },
]
const f = n => n.toFixed(1)
const comma = n => String(n).replace(/\B(?=(\d{3})+(?!\d))/g, ',')

const text = (x, y, s, { size = 9, fill = MUTED, anchor = 'start', font = FONT } = {}) =>
  `<text x="${f(x)}" y="${f(y)}"${anchor === 'start' ? '' : ` text-anchor="${anchor}"`} font-size="${size}" font-family="${font}" fill="${fill}">${s}</text>`

function draw() {
  const half = n => ((BAND.right - BAND.left) * n) / STEPS[0].n / 2
  const barY = i => TOP + i * SLOT
  // The biggest drop is the step that keeps the smallest share (here it also loses the most people)
  let worst = 1
  for (let i = 1; i < STEPS.length; i++) if (STEPS[i].n / STEPS[i - 1].n < STEPS[worst].n / STEPS[worst - 1].n) worst = i
  const parts = [`<rect width="${W}" height="${H}" rx="4" fill="${STAGE}"/>`]

  STEPS.forEach((s, i) => {
    const y = barY(i)
    if (i > 0) {
      const a = half(STEPS[i - 1].n)
      const b = half(s.n)
      const y0 = barY(i - 1) + BAR
      const bad = i === worst
      parts.push(`<path d="M${f(CX - a)} ${f(y0)}L${f(CX + a)} ${f(y0)}L${f(CX + b)} ${f(y)}L${f(CX - b)} ${f(y)}Z" fill="${bad ? DOWN : INK}" fill-opacity="${bad ? 0.25 : 0.08}"/>`)
      const pct = Math.round((100 * s.n) / STEPS[i - 1].n)
      const mid = (y0 + y) / 2 + 3
      parts.push(text(CX, mid, `${pct}%`, { fill: bad ? DOWN : MUTED, anchor: 'middle' }))
      if (bad) parts.push(text(CX + a + 8, mid, `LOST ${comma(STEPS[i - 1].n - s.n)}`, { fill: DOWN }))
    }
    parts.push(`<rect x="${f(CX - half(s.n))}" y="${f(y)}" width="${f(2 * half(s.n))}" height="${f(BAR)}" fill="${INK}" fill-opacity="0.25"/>`)
    parts.push(text(12, y + BAR / 2 + 3.5, s.name, { size: 10, fill: INK }))
    parts.push(text(W - 12, y + BAR / 2 + 4, comma(s.n), { size: 11, fill: INK, anchor: 'end' }))
  })

  const last = STEPS[STEPS.length - 1].n
  parts.push(text(12, H - 8, 'SAMPLE MOD, LAST 30 DAYS'))
  parts.push(text(W - 12, H - 8, `PAID ${((100 * last) / STEPS[0].n).toFixed(1)}% OF INSTALLS`, { anchor: 'end' }))
  return `<svg xmlns="http://www.w3.org/2000/svg" viewBox="0 0 ${W} ${H}" width="${W}" height="${H}">${parts.join('')}</svg>`
}

let source // drawn on first use and kept: the pane loads every design, so none pays at load time
export default {
  id: 'funnel',
  title: 'Funnel chart',
  category: 'parts',
  description: 'Five centred bars from install to paid with the conversion of each step between them; the step that loses the most people is drawn in red.',
  element: ui => ui.Svg({ source: (source ??= draw()), alt: 'Funnel of a mod from install to paid in five steps, the drop from first run to daily in red, sample data', width: W, height: H }),
}
To use it in a mod: copy the file to your mod's hooks/designs/ and return its element(ui) from a pane's ui.render. How a pane is built.
Code: PolyForm Noncommercial License 1.0.0: noncommercial use only. Required Notice: Copyright 2026 Haruki Nakada (https://modscode.com).