ModsCode / Gallery / Designs / Dumbbell chart
Dumbbell chart
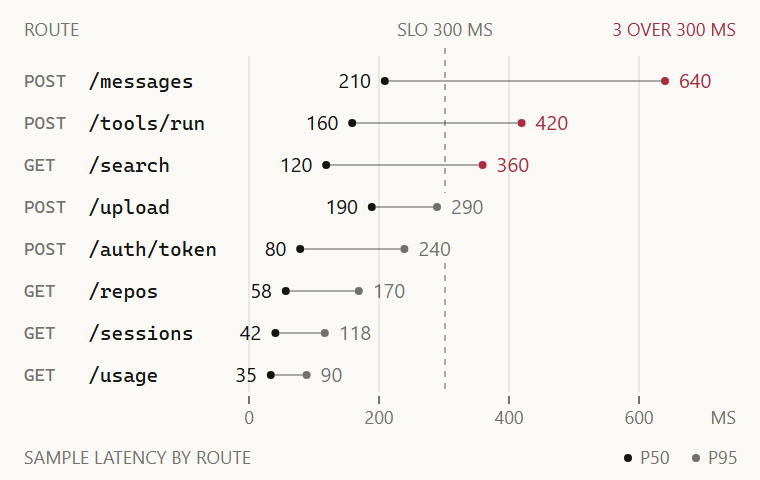
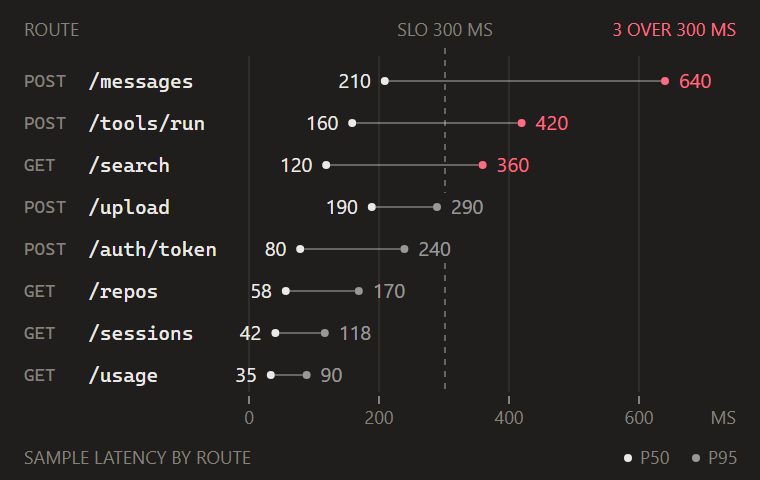
p50 and p95 latency per API route on one scale: a thin link between two dots, values at both ends, the p95 dot red past the latency objective.
hooks/designs/dumbbell.mjs
// dumbbell: p50 and p95 latency for eight API routes in candle's look, sorted by p95 from the slowest.
// Each route is a 1px link at 35% ink between two dots on one shared scale from 0 to 700 ms, the round
// number just past the slowest p95 (640). The p50 dot is ink; the p95 dot turns DOWN only past the
// 300 ms objective, drawn as candle's dashed 35% reference line, so the eye finds the slow tails without
// reading a number. The values sit outside both ends and are dropped when they would touch the route
// name; where a value crosses the reference line, the line breaks around it instead of the value moving,
// because a moved value would no longer sit on its dot. Routes, p50 / p95 in ms: POST /messages 210 / 640, POST /tools/run 160 / 420, GET /search
// 120 / 360, POST /upload 190 / 290, POST /auth/token 80 / 240, GET /repos 58 / 170, GET /sessions 42 /
// 118, GET /usage 35 / 90. The count over the objective is counted from the rows. Sample data only.
const W = 380
const H = 240
const STAGE = '#FAF9F5'
const INK = '#141413'
const MUTED = '#73726C'
const DOWN = '#AB2B3F'
const FONT = "'Inter Tight','Segoe UI',system-ui,sans-serif"
const MONO = "ui-monospace,'Cascadia Mono',Consolas,monospace"
const X0 = 124 // 0 ms; the method and path sit in the column before it
const X1 = 352 // 700 ms; the p95 values run into the space after it
const MAX = 700
const SLO = 300
const ROW0 = 40
const ROW = 21
const R = 2
const PLOT = { top: 28, bottom: 196 }
const f = n => n.toFixed(1)

const ROUTES = [
  ['POST', '/messages', 210, 640],
  ['POST', '/tools/run', 160, 420],
  ['GET', '/search', 120, 360],
  ['POST', '/upload', 190, 290],
  ['POST', '/auth/token', 80, 240],
  ['GET', '/repos', 58, 170],
  ['GET', '/sessions', 42, 118],
  ['GET', '/usage', 35, 90],
].sort((a, b) => b[3] - a[3])
const OVER = ROUTES.filter(r => r[3] > SLO).length

const text = (x, y, s, { size = 9, fill = MUTED, anchor = 'start', font = FONT, opacity } = {}) =>
  `<text x="${f(x)}" y="${f(y)}"${anchor === 'start' ? '' : ` text-anchor="${anchor}"`} font-size="${size}" font-family="${font}" fill="${fill}"${opacity ? ` fill-opacity="${opacity}"` : ''}>${s}</text>`
const x = ms => X0 + (ms / MAX) * (X1 - X0)
const width10 = s => s.length * 5.6 * 1.1 // a 10px label's width with 10% slack

function draw() {
  const parts = [`<rect width="${W}" height="${H}" rx="4" fill="${STAGE}"/>`]
  for (const t of [0, 200, 400, 600]) {
    const tx = Math.round(x(t)) + 0.5
    parts.push(`<line x1="${f(tx)}" x2="${f(tx)}" y1="${PLOT.top}" y2="${PLOT.bottom}" stroke="${INK}" stroke-opacity="0.08" stroke-width="1"/>`)
    parts.push(`<line x1="${f(tx)}" x2="${f(tx)}" y1="${PLOT.bottom + 2}" y2="${PLOT.bottom + 6}" stroke="${MUTED}" stroke-width="1"/>`)
    parts.push(text(tx, PLOT.bottom + 16, String(t), { anchor: 'middle' }))
  }
  parts.push(text(W - 12, PLOT.bottom + 16, 'MS', { anchor: 'end' }))
  const sx = Math.round(x(SLO)) + 0.5
  const rows = []
  const gaps = [] // [top, bottom] spans where a value label sits on the reference line
  const label = (x0, x1, cy, svg) => {
    if (sx > x0 - 3 && sx < x1 + 3) gaps.push([cy - 7, cy + 7])
    rows.push(svg)
  }
  parts.push(text(12, 18, 'ROUTE'))
  parts.push(text(W - 12, 18, `${OVER} OVER ${SLO} MS`, { fill: DOWN, anchor: 'end' }))

  ROUTES.forEach(([method, path, p50, p95], i) => {
    const cy = ROW0 + i * ROW + 0.5 // on a pixel centre so the 1px link stays sharp
    const a = x(p50)
    const b = x(p95)
    const slow = p95 > SLO
    rows.push(text(12, cy + 3, method, { font: MONO }))
    rows.push(text(44, cy + 3.5, path, { size: 10, fill: INK, font: MONO }))
    rows.push(`<line x1="${f(a + R)}" x2="${f(b - R)}" y1="${f(cy)}" y2="${f(cy)}" stroke="${INK}" stroke-opacity="0.35" stroke-width="1"/>`)
    rows.push(`<circle cx="${f(a)}" cy="${f(cy)}" r="${R}" fill="${INK}"/>`)
    rows.push(`<circle cx="${f(b)}" cy="${f(cy)}" r="${R}" fill="${slow ? DOWN : INK}"${slow ? '' : ' fill-opacity="0.6"'}/>`)
    // The p50 value steps aside rather than touch the path; the p95 value stops at W - 12
    const nameEnd = 44 + path.length * 6 + 4
    const left = String(p50)
    if (a - R - 5 - width10(left) > nameEnd) label(a - R - 5 - left.length * 5.6, a - R - 5, cy, text(a - R - 5, cy + 3.5, left, { size: 10, fill: INK, anchor: 'end' }))
    const right = String(p95)
    if (b + R + 5 + width10(right) <= W - 12) label(b + R + 5, b + R + 5 + right.length * 5.6, cy, text(b + R + 5, cy + 3.5, right, { size: 10, fill: slow ? DOWN : INK, opacity: slow ? undefined : 0.6 }))
  })

  // The reference line goes under the rows, as one path with a break at each value it would cross;
  // breaks less than 9px apart join, since a lone dash between two values reads as a mark of its own
  let d = ''
  let top = PLOT.top - 4
  for (const [g0, g1] of gaps.sort((p, q) => p[0] - q[0])) {
    if (g0 > top + 9) d += `M${f(sx)} ${f(top)}V${f(g0)}`
    top = Math.max(top, g1)
  }
  if (PLOT.bottom > top) d += `M${f(sx)} ${f(top)}V${PLOT.bottom}`
  parts.push(`<path d="${d}" fill="none" stroke="${INK}" stroke-opacity="0.35" stroke-width="1" stroke-dasharray="3 3"/>`)
  parts.push(text(sx, 18, `SLO ${SLO} MS`, { anchor: 'middle' }))
  parts.push(...rows)

  parts.push(`<circle cx="${W - 66}" cy="${H - 11}" r="${R}" fill="${INK}"/>`)
  parts.push(text(W - 60, H - 8, 'P50'))
  parts.push(`<circle cx="${W - 32}" cy="${H - 11}" r="${R}" fill="${INK}" fill-opacity="0.6"/>`)
  parts.push(text(W - 26, H - 8, 'P95'))
  parts.push(text(12, H - 8, 'SAMPLE LATENCY BY ROUTE'))
  return `<svg xmlns="http://www.w3.org/2000/svg" viewBox="0 0 ${W} ${H}" width="${W}" height="${H}">${parts.join('')}</svg>`
}

let source // drawn on first use and kept: the pane loads every design, so none pays at load time
export default {
  id: 'dumbbell',
  title: 'Dumbbell chart',
  category: 'compare',
  description: 'p50 and p95 latency per API route on one scale: a thin link between two dots, values at both ends, the p95 dot red past the latency objective.',
  element: ui => ui.Svg({ source: (source ??= draw()), alt: `Dumbbell chart of p50 and p95 latency for ${ROUTES.length} API routes against a ${SLO} ms objective, ${OVER} of them over it, sample data`, width: W, height: H }),
}
To use it in a mod: copy the file to your mod's hooks/designs/ and return its element(ui) from a pane's ui.render. How a pane is built.
Code: PolyForm Noncommercial License 1.0.0: noncommercial use only. Required Notice: Copyright 2026 Haruki Nakada (https://modscode.com).