ModsCode / Gallery / Designs / Spend against budget
Spend against budget
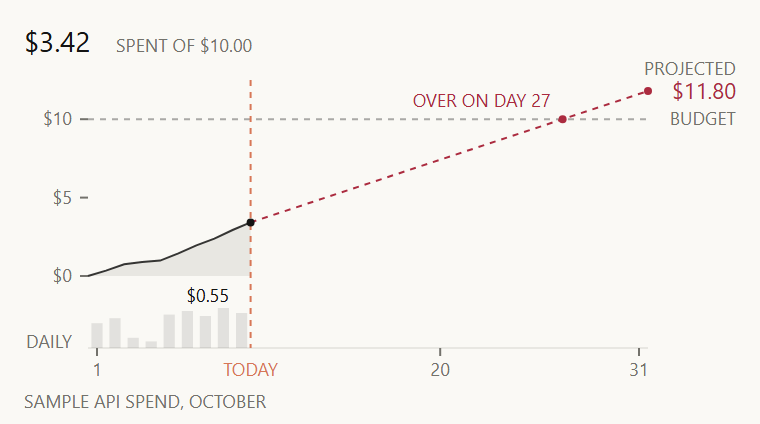
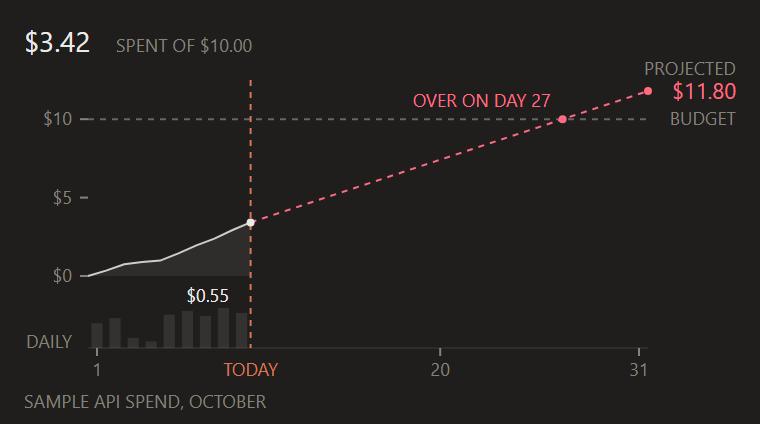
Running spend for the month against a flat budget, with a least-squares projection to month end that turns red when it would go over.
hooks/designs/cost-burn.mjs
// cost-burn: a month's running spend against a flat budget, in candle's look. Nine days of API spend
// for October 2026 (the 1st is a Thursday, so days 3-4 are the quiet weekend) sum to $3.42 of a $10.00
// budget. The dashed projection carries today's total forward at the least-squares slope of the nine
// cumulative points (0.381 a day), so it starts at the today dot instead of jumping to the fitted line;
// it ends at $11.80 on day 31 and turns DOWN because that passes the budget, which it crosses on day 27.
// The daily amounts sit in a strip under the plot like candle's volume (62% of a slot at 10% ink).
// Today is the one Claude orange mark. The projection text is computed from the dailies, never typed.
// Sample data only.
const W = 380
const H = 212
const STAGE = '#FAF9F5'
const INK = '#141413'
const MUTED = '#73726C'
const DOWN = '#AB2B3F'
const UP = '#2C7A39'
const CLAUDE = '#D77757'
const FONT = "'Inter Tight','Segoe UI',system-ui,sans-serif"
const PLOT = { left: 44, right: 324, top: 40, bottom: 138 }
const STRIP = { top: 154, bottom: 174 }
const DAYS = 31
const BUDGET = 10
const Y_MAX = 12.5 // the top of the scale: room for the projection's end above the budget
// Thu Fri Sat Sun Mon Tue Wed Thu Fri: dollars spent each day, 1 to 9 October
const DAILY = [0.34, 0.41, 0.14, 0.09, 0.46, 0.51, 0.44, 0.55, 0.48]
const TODAY = DAILY.length
const f = n => n.toFixed(1)
const money = v => '$' + v.toFixed(2)

const text = (x, y, s, { size = 9, fill = MUTED, anchor = 'start' } = {}) =>
  `<text x="${f(x)}" y="${f(y)}"${anchor === 'start' ? '' : ` text-anchor="${anchor}"`} font-size="${size}" font-family="${FONT}" fill="${fill}">${s}</text>`

// Ordinary least squares of cumulative spend on day number (days 1..n)
function slopeOf(cum) {
  const n = cum.length
  const mx = (n + 1) / 2
  const my = cum.reduce((a, b) => a + b, 0) / n
  let sxy = 0
  let sxx = 0
  cum.forEach((y, i) => {
    sxy += (i + 1 - mx) * (y - my)
    sxx += (i + 1 - mx) ** 2
  })
  return sxy / sxx
}

function draw() {
  const cum = []
  DAILY.reduce((sum, d) => (cum.push(sum + d), sum + d), 0)
  const spent = cum[TODAY - 1]
  const slope = slopeOf(cum)
  const projected = spent + slope * (DAYS - TODAY)
  const over = projected > BUDGET
  const crossDay = TODAY + (BUDGET - spent) / slope // where the projection meets the budget line

  const x = d => PLOT.left + ((PLOT.right - PLOT.left) * d) / DAYS // day 0 is the month's start at $0
  const y = v => PLOT.bottom - ((PLOT.bottom - PLOT.top) * v) / Y_MAX
  const slot = (PLOT.right - PLOT.left) / DAYS
  const parts = [`<rect width="${W}" height="${H}" rx="4" fill="${STAGE}"/>`]

  // Header: spend so far and the budget it counts against
  parts.push(text(12, 26, money(spent), { size: 14, fill: INK }))
  parts.push(text(58, 26, `SPENT OF ${money(BUDGET)}`))

  // Left scale: 4px stubs, no axis line
  for (const v of [0, 5, 10]) {
    parts.push(`<line x1="${PLOT.left - 4}" x2="${PLOT.left}" y1="${f(y(v))}" y2="${f(y(v))}" stroke="${MUTED}" stroke-width="1"/>`)
    parts.push(text(PLOT.left - 8, y(v) + 3, '$' + v, { anchor: 'end' }))
  }

  // Budget: a reference line at 35% ink that runs the whole month
  parts.push(`<line x1="${PLOT.left}" x2="${PLOT.right}" y1="${f(y(BUDGET))}" y2="${f(y(BUDGET))}" stroke="${INK}" stroke-opacity="0.35" stroke-dasharray="3 3"/>`)
  parts.push(text(W - 12, y(BUDGET) + 3, 'BUDGET', { anchor: 'end' }))

  // Spend so far: a faint area under a 1px line, from $0 at the month's start
  const pts = [[x(0), y(0)], ...cum.map((v, i) => [x(i + 1), y(v)])]
  const line = pts.map(([px, py]) => `${f(px)},${f(py)}`).join(' ')
  parts.push(`<polygon points="${line} ${f(x(TODAY))},${f(y(0))}" fill="${INK}" fill-opacity="0.08"/>`)
  parts.push(`<polyline points="${line}" fill="none" stroke="${INK}" stroke-opacity="0.85" stroke-width="1"/>`)

  // Projection to day 31, red when it ends over budget
  const pc = over ? DOWN : UP
  parts.push(`<line x1="${f(x(TODAY))}" y1="${f(y(spent))}" x2="${f(x(DAYS))}" y2="${f(y(projected))}" stroke="${pc}" stroke-width="1" stroke-dasharray="3 3"/>`)
  parts.push(`<circle cx="${f(x(DAYS))}" cy="${f(y(projected))}" r="2" fill="${pc}"/>`)
  parts.push(text(W - 12, y(projected) - 8, 'PROJECTED', { anchor: 'end' }))
  parts.push(text(W - 12, y(projected) + 4, money(projected), { size: 11, fill: pc, anchor: 'end' }))
  if (over) {
    // The day the running total passes the budget: the projection crosses during day ceil(crossDay)
    const cx = x(crossDay)
    parts.push(`<circle cx="${f(cx)}" cy="${f(y(BUDGET))}" r="2" fill="${DOWN}"/>`)
    parts.push(text(cx - 6, y(BUDGET) - 6, `OVER ON DAY ${Math.ceil(crossDay)}`, { fill: DOWN, anchor: 'end' }))
  }

  // Daily amounts: candle's volume strip, 62% of a slot at 10% ink; the largest day carries its value
  const dmax = Math.max(...DAILY)
  let big = 0
  DAILY.forEach((d, i) => {
    if (d > DAILY[big]) big = i
    const h = ((STRIP.bottom - STRIP.top) * d) / dmax
    const cx = x(i + 1) - slot / 2
    parts.push(`<rect x="${f(cx - slot * 0.31)}" y="${f(STRIP.bottom - h)}" width="${f(slot * 0.62)}" height="${f(h)}" fill="${INK}" fill-opacity="0.1"/>`)
  })
  parts.push(text(PLOT.left - 8, STRIP.bottom, 'DAILY', { anchor: 'end' }))
  // Anchored at the bar's right edge so the value keeps clear of the today line on its right
  parts.push(text(x(big + 1) - slot * 0.19, STRIP.top - 3, money(DAILY[big]), { fill: INK, anchor: 'end' }))
  parts.push(`<line x1="${PLOT.left}" x2="${PLOT.right}" y1="${STRIP.bottom}" y2="${STRIP.bottom}" stroke="${INK}" stroke-opacity="0.08"/>`)

  // Today: the dot ends the line, the Claude orange dashed line runs through the plot and the strip
  const tx = x(TODAY)
  parts.push(`<line x1="${f(tx)}" x2="${f(tx)}" y1="${PLOT.top}" y2="${STRIP.bottom}" stroke="${CLAUDE}" stroke-width="1" stroke-dasharray="3 3"/>`)
  parts.push(`<circle cx="${f(tx)}" cy="${f(y(spent))}" r="2" fill="${INK}"/>`)

  // Day ticks under the strip: the month's ends, the 20th, and today in Claude orange
  for (const d of [1, 20, DAYS]) {
    const cx = x(d) - slot / 2
    parts.push(`<line x1="${f(cx)}" x2="${f(cx)}" y1="${STRIP.bottom}" y2="${STRIP.bottom + 4}" stroke="${MUTED}" stroke-width="1"/>`)
    parts.push(text(cx, STRIP.bottom + 14, String(d), { anchor: 'middle' }))
  }
  parts.push(text(tx, STRIP.bottom + 14, 'TODAY', { fill: CLAUDE, anchor: 'middle' }))
  parts.push(text(12, H - 8, 'SAMPLE API SPEND, OCTOBER'))
  return `<svg xmlns="http://www.w3.org/2000/svg" viewBox="0 0 ${W} ${H}" width="${W}" height="${H}">${parts.join('')}</svg>`
}

let source // drawn on first use and kept: the pane loads every design, so none pays at load time
export default {
  id: 'cost-burn',
  title: 'Spend against budget',
  category: 'usage',
  description: 'Running spend for the month against a flat budget, with a least-squares projection to month end that turns red when it would go over.',
  element: ui => ui.Svg({ source: (source ??= draw()), alt: 'Cumulative monthly spend line against a flat budget with a dashed projection to month end and today marked, sample data', width: W, height: H }),
}
To use it in a mod: copy the file to your mod's hooks/designs/ and return its element(ui) from a pane's ui.render. How a pane is built.
Code: PolyForm Noncommercial License 1.0.0: noncommercial use only. Required Notice: Copyright 2026 Haruki Nakada (https://modscode.com).