ModsCode / Gallery / Designs / Bullet graphs
Bullet graphs
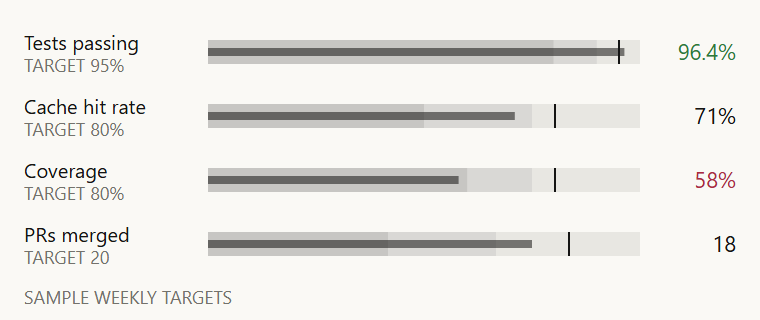
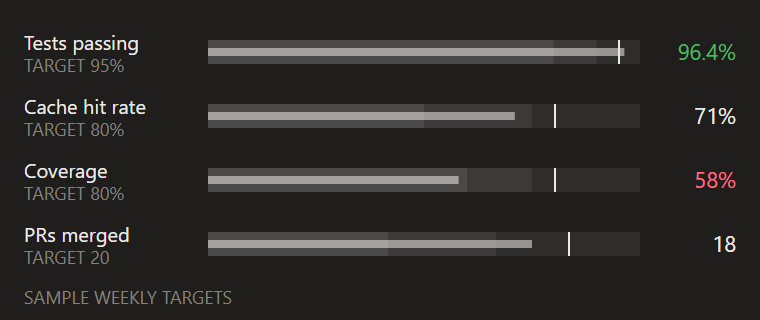
Four bullet graphs: poor, fair and good ranges in ink steps, a thin value bar and a target tick; the value turns green once the target is met.
hooks/designs/bullet.mjs
// bullet: four bullet graphs in candle's look, after Stephen Few's bullet graph (an open design idea,
// not code). Each row has its own scale from zero: three qualitative ranges as ink at 22%, 14% and 8%
// (the strongest on the poor end, as Few draws it on paper), the value bar a third of the band's
// height at candle's 55% body fill, and a 1px ink tick for the target. The number on the right turns
// UP once the target is met and DOWN while the value sits in the poor range. The rows: tests passing
// 96.4% (target 95, ranges 80/90/100), cache hit rate 71% (target 80, ranges 50/75/100), coverage 58%
// (target 80, ranges 60/75/100), PRs merged 18 (target 20, ranges 10/16/24). Sample data only.
const W = 380
const H = 160
const STAGE = '#FAF9F5'
const INK = '#141413'
const MUTED = '#73726C'
const UP = '#2C7A39'
const DOWN = '#AB2B3F'
const FONT = "'Inter Tight','Segoe UI',system-ui,sans-serif"
const BX0 = 104 // the band's left edge; the names sit in the column before it
const BX1 = 320 // the band's right edge; the values sit after it, right-aligned at W - 12
const ROW0 = 26
const ROW = 32
const BAND = 12
const BAR = 4
const RANGE_OPACITY = [0.22, 0.14, 0.08] // poor, fair, good
const f = n => n.toFixed(1)

// ranges are the upper ends of poor, fair and good; the last one is the end of the scale
const KPIS = [
  { name: 'Tests passing', value: 96.4, target: 95, ranges: [80, 90, 100], unit: '%' },
  { name: 'Cache hit rate', value: 71, target: 80, ranges: [50, 75, 100], unit: '%' },
  { name: 'Coverage', value: 58, target: 80, ranges: [60, 75, 100], unit: '%' },
  { name: 'PRs merged', value: 18, target: 20, ranges: [10, 16, 24], unit: '' },
]

const text = (x, y, s, { size = 9, fill = MUTED, anchor = 'start' } = {}) =>
  `<text x="${f(x)}" y="${f(y)}"${anchor === 'start' ? '' : ` text-anchor="${anchor}"`} font-size="${size}" font-family="${FONT}" fill="${fill}">${s}</text>`

function row(k, i) {
  const cy = ROW0 + i * ROW
  const max = k.ranges[k.ranges.length - 1]
  const x = v => BX0 + (v / max) * (BX1 - BX0)
  const parts = []
  let from = 0
  k.ranges.forEach((to, j) => {
    parts.push(`<rect x="${f(x(from))}" y="${f(cy - BAND / 2)}" width="${f(x(to) - x(from))}" height="${BAND}" fill="${INK}" fill-opacity="${RANGE_OPACITY[j]}"/>`)
    from = to
  })
  parts.push(`<rect x="${BX0}" y="${f(cy - BAR / 2)}" width="${f(x(k.value) - BX0)}" height="${BAR}" fill="${INK}" fill-opacity="0.55"/>`)
  // The tick sits on a pixel centre so the 1px line stays sharp
  const tx = Math.round(x(k.target)) + 0.5
  parts.push(`<line x1="${f(tx)}" x2="${f(tx)}" y1="${f(cy - BAND / 2)}" y2="${f(cy + BAND / 2)}" stroke="${INK}" stroke-width="1"/>`)
  parts.push(text(12, cy - 1, k.name, { size: 10, fill: INK }))
  parts.push(text(12, cy + 10, `TARGET ${k.target}${k.unit}`))
  const state = k.value >= k.target ? UP : k.value < k.ranges[0] ? DOWN : INK
  parts.push(text(W - 12, cy + 4, `${k.value}${k.unit}`, { size: 11, fill: state, anchor: 'end' }))
  return parts.join('')
}

function draw() {
  const parts = [`<rect width="${W}" height="${H}" rx="4" fill="${STAGE}"/>`]
  KPIS.forEach((k, i) => parts.push(row(k, i)))
  parts.push(text(12, H - 8, 'SAMPLE WEEKLY TARGETS'))
  return `<svg xmlns="http://www.w3.org/2000/svg" viewBox="0 0 ${W} ${H}" width="${W}" height="${H}">${parts.join('')}</svg>`
}

let source // drawn on first use and kept: the pane loads every design, so none pays at load time
export default {
  id: 'bullet',
  title: 'Bullet graphs',
  category: 'usage',
  description: 'Four bullet graphs: poor, fair and good ranges in ink steps, a thin value bar and a target tick; the value turns green once the target is met.',
  element: ui => ui.Svg({ source: (source ??= draw()), alt: 'Four bullet graphs for tests passing, cache hit rate, coverage and PRs merged against their targets, sample data', width: W, height: H }),
}
To use it in a mod: copy the file to your mod's hooks/designs/ and return its element(ui) from a pane's ui.render. How a pane is built.
Code: PolyForm Noncommercial License 1.0.0: noncommercial use only. Required Notice: Copyright 2026 Haruki Nakada (https://modscode.com).