ModsCode / Gallery / Designs / Latency with SLO
Latency with SLO
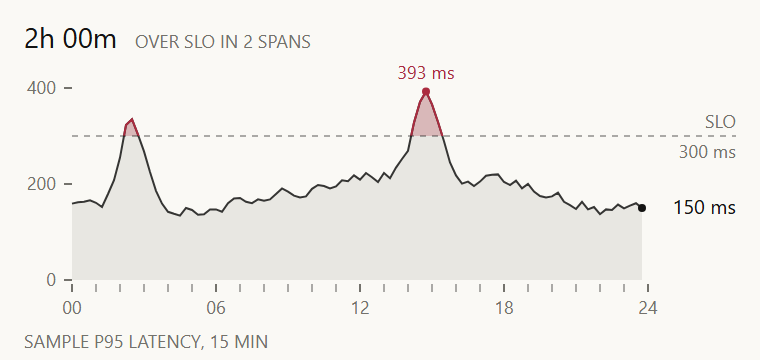
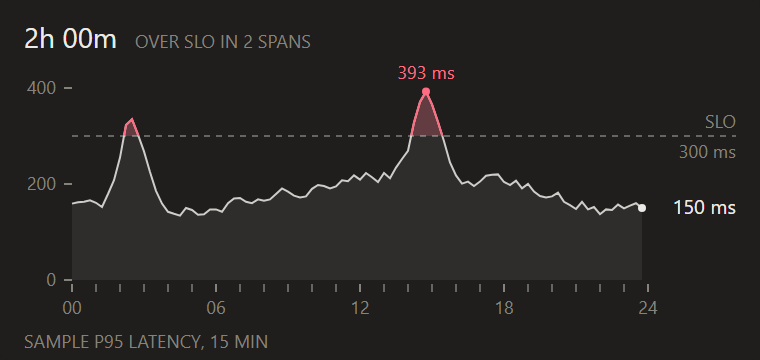
Latency as a faint area under a thin line, with a dashed SLO and every span above it tinted red and counted in the header.
hooks/designs/area-threshold.mjs
// area-threshold: a day of p95 latency for an MCP tool server against a 300 ms SLO, in candle's look.
// 96 points (15-minute steps from 00:00) on a night floor near 150 ms and a daytime hump near 220 ms,
// plus two incidents: a nightly reindex at 02:15-02:45 (3 points over, top 335 ms) and a deploy at
// 14:15-15:15 (5 points over, peak 393 ms at 14:45). The area under the line is ink at 8%; the part
// above the dashed SLO is the same area clipped to the band over 300 ms and filled DOWN at 25%, and the
// line turns DOWN there too, so a breach reads without a legend. The hero counts the points over the SLO
// (8 x 15 min = 2h 00m in 2 spans), computed from the data, never typed. The peak carries its value, the
// last value (150 ms) sits in the right gutter like candle's, and the scale end is the peak rounded up
// to a whole 100 ms (400), so the SLO sits at three quarters. Sample data only.
const W = 380
const H = 180
const STAGE = '#FAF9F5'
const INK = '#141413'
const MUTED = '#73726C'
const DOWN = '#AB2B3F'
const FONT = "'Inter Tight','Segoe UI',system-ui,sans-serif"
const PLOT = { left: 36, right: 324, top: 44, bottom: 140 }
const N = 96 // 15-minute steps over 24 hours
const STEP = 15
const SLO = 300
const f = n => n.toFixed(1)
// Estimated text width: m, w and % run wide, spaces and dots narrow, the rest about 0.56 em
const wide = (s, size) => [...s].reduce((w, c) => w + size * (/[mwMW%]/.test(c) ? 0.85 : /[ .,:il1]/.test(c) ? 0.3 : 0.56), 0)

// A seeded walk, so the picture is the same on every render
function rng(seed) {
  return () => (seed = (Math.imul(seed, 1103515245) + 12345) & 0x7fffffff) / 0x7fffffff
}

const text = (x, y, s, { size = 9, fill = MUTED, anchor = 'start' } = {}) =>
  `<text x="${f(x)}" y="${f(y)}"${anchor === 'start' ? '' : ` text-anchor="${anchor}"`} font-size="${size}" font-family="${FONT}" fill="${fill}">${s}</text>`

// Night floor, a daytime hump peaking mid-afternoon, two incidents and a smoothed seeded wobble
function sample() {
  const rnd = rng(20261011)
  const out = []
  let wobble = 0
  for (let i = 0; i < N; i++) {
    const h = (i * STEP) / 60
    const day = Math.max(0, Math.sin((Math.PI * (h - 6)) / 16))
    const bump = (at, amp, width) => amp * Math.exp(-(((h - at) / width) ** 2))
    wobble = 0.6 * wobble + (rnd() - 0.5) * 26
    out.push(Math.round(150 + 70 * day + bump(2.5, 190, 0.7) + bump(14.75, 165, 0.7) + wobble))
  }
  return out
}

const duration = min => (min >= 60 ? `${Math.floor(min / 60)}h ${String(min % 60).padStart(2, '0')}m` : `${min}m`)

function draw() {
  const vals = sample()
  const peakAt = vals.indexOf(Math.max(...vals))
  const peak = vals[peakAt]
  const top = Math.ceil(peak / 100) * 100
  const x = i => PLOT.left + ((PLOT.right - PLOT.left) * i) / N // i = 96 is 24:00, the right edge
  const y = v => PLOT.bottom - ((PLOT.bottom - PLOT.top) * v) / top
  const sloY = y(SLO)
  const over = vals.filter(v => v > SLO).length
  // A span is a run of points over the SLO
  const spans = vals.reduce((n, v, i) => n + (v > SLO && !(vals[i - 1] > SLO) ? 1 : 0), 0)
  const parts = [`<rect width="${W}" height="${H}" rx="4" fill="${STAGE}"/>`]

  // Header: time over the SLO, counted in whole 15-minute points
  const hero = duration(over * STEP)
  parts.push(text(12, 24, hero, { size: 14, fill: INK }))
  parts.push(text(12 + wide(hero, 14) + 8, 24, `OVER SLO IN ${spans} SPAN${spans === 1 ? '' : 'S'}`))

  // Left scale: 4px stubs, no axis line
  for (const v of [0, top / 2, top]) {
    parts.push(`<line x1="${PLOT.left - 4}" x2="${PLOT.left}" y1="${f(y(v))}" y2="${f(y(v))}" stroke="${MUTED}" stroke-width="1"/>`)
    parts.push(text(PLOT.left - 8, y(v) + 3, String(v), { anchor: 'end' }))
  }

  const pts = vals.map((v, i) => `${f(x(i))},${f(y(v))}`).join(' ')
  const area = `${f(x(0))},${PLOT.bottom} ${pts} ${f(x(N - 1))},${PLOT.bottom}`
  // The band above the SLO; the area and the line are drawn a second time inside it in DOWN
  parts.push(`<defs><clipPath id="area-threshold-over"><rect x="${PLOT.left}" y="${PLOT.top - 12}" width="${PLOT.right - PLOT.left}" height="${f(sloY - PLOT.top + 12)}"/></clipPath></defs>`)
  parts.push(`<polygon points="${area}" fill="${INK}" fill-opacity="0.08"/>`)
  parts.push(`<polygon points="${area}" fill="${DOWN}" fill-opacity="0.25" clip-path="url(#area-threshold-over)"/>`)
  parts.push(`<polyline points="${pts}" fill="none" stroke="${INK}" stroke-opacity="0.85" stroke-width="1"/>`)
  parts.push(`<polyline points="${pts}" fill="none" stroke="${DOWN}" stroke-width="1" clip-path="url(#area-threshold-over)"/>`)

  // SLO: a reference line at 35% ink that runs into the right gutter, its label above and below it
  parts.push(`<line x1="${PLOT.left}" x2="${W - 12}" y1="${f(sloY)}" y2="${f(sloY)}" stroke="${INK}" stroke-opacity="0.35" stroke-dasharray="3 3"/>`)
  parts.push(text(W - 12, sloY - 4, 'SLO', { anchor: 'end' }))
  parts.push(text(W - 12, sloY + 11, `${SLO} ms`, { anchor: 'end' }))

  // The peak carries its value just above the point
  const px = Math.min(PLOT.right - 16, Math.max(PLOT.left + 16, x(peakAt)))
  parts.push(`<circle cx="${f(x(peakAt))}" cy="${f(y(peak))}" r="2" fill="${DOWN}"/>`)
  parts.push(text(px, y(peak) - 6, `${peak} ms`, { fill: DOWN, anchor: 'middle' }))

  // The last value: a dot on the line end and its value in the gutter, stepping off the SLO labels
  const last = vals[N - 1]
  let ly = y(last) + 3
  if (Math.abs(ly - sloY) < 16) ly = sloY + 24
  parts.push(`<circle cx="${f(x(N - 1))}" cy="${f(y(last))}" r="2" fill="${INK}"/>`)
  parts.push(text(W - 12, ly, `${last} ms`, { size: 10, fill: INK, anchor: 'end' }))

  // Hour ticks: a stub every hour, a label every six
  for (let hr = 0; hr <= 24; hr++) {
    const tx = x((hr * 60) / STEP)
    const labelled = hr % 6 === 0
    parts.push(`<line x1="${f(tx)}" x2="${f(tx)}" y1="${PLOT.bottom + 2}" y2="${PLOT.bottom + 6}" stroke="${labelled ? MUTED : INK}" stroke-width="1"${labelled ? '' : ' stroke-opacity="0.35"'}/>`)
    if (labelled) parts.push(text(tx, PLOT.bottom + 17, String(hr).padStart(2, '0'), { anchor: 'middle' }))
  }
  parts.push(text(12, H - 6, `SAMPLE P95 LATENCY, ${STEP} MIN`))
  return `<svg xmlns="http://www.w3.org/2000/svg" viewBox="0 0 ${W} ${H}" width="${W}" height="${H}">${parts.join('')}</svg>`
}

let source // drawn on first use and kept: the pane loads every design, so none pays at load time
export default {
  id: 'area-threshold',
  title: 'Latency with SLO',
  category: 'time',
  description: 'Latency as a faint area under a thin line, with a dashed SLO and every span above it tinted red and counted in the header.',
  element: ui => ui.Svg({ source: (source ??= draw()), alt: 'Area chart of tail latency over a day with a dashed SLO line and the spans above it shaded red, sample data', width: W, height: H }),
}
To use it in a mod: copy the file to your mod's hooks/designs/ and return its element(ui) from a pane's ui.render. How a pane is built.
Code: PolyForm Noncommercial License 1.0.0: noncommercial use only. Required Notice: Copyright 2026 Haruki Nakada (https://modscode.com).