ModsCode / Claude Code Mods / Build / Designs
Claude Code Mods designs
Each design is one file of look, a mod by the maker of ModsCode (not one of the listed mods): a pane the desktop app draws, in Claude's colours, light or dark with the theme. Sample data only: no feed, no keys, nothing sent. How a pane is built.
Categories54 designs
Over time
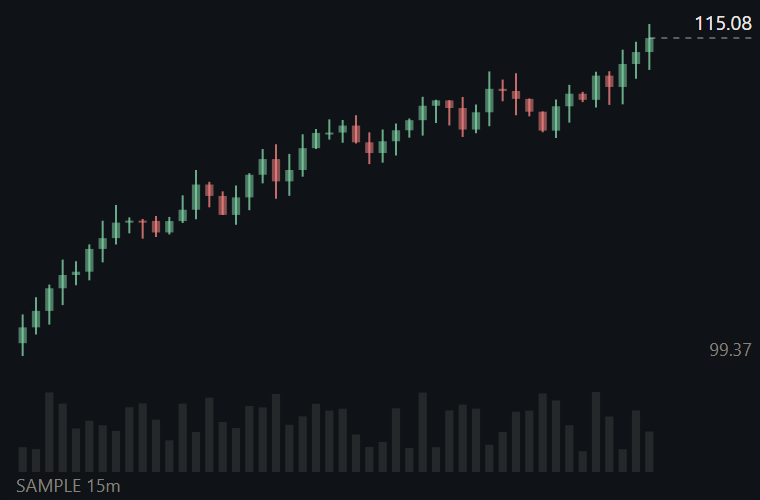 Candlestick chartCandlestick chart of 15-minute bars with volume and a dashed last-value line; the look every other design follows.
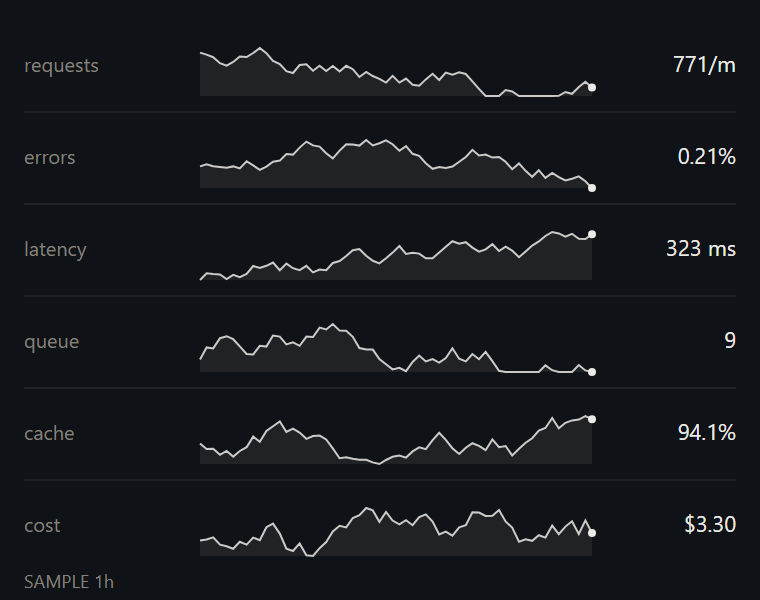 SparklinesSix sparkline rows, each a 1px line over a faint area with a dot and its last value, so level and move read without axes.
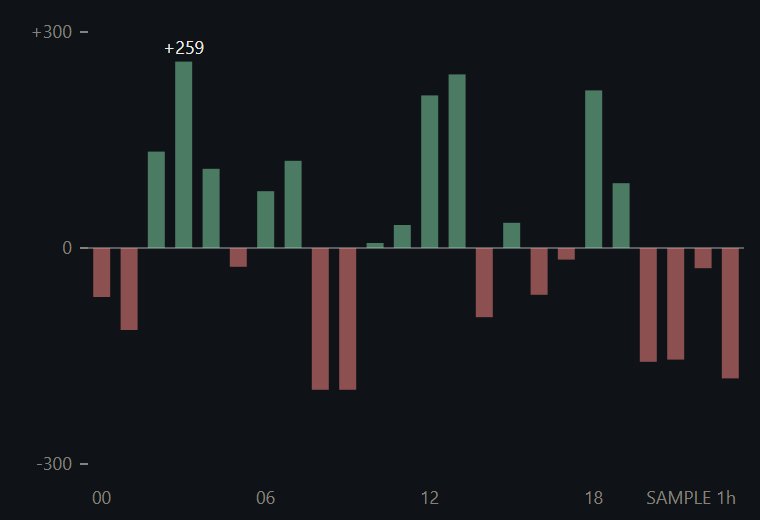 Bar chart around zeroTwenty-four hourly bars around a zero line, up and down on one scale, with the largest bar labelled at its tip.
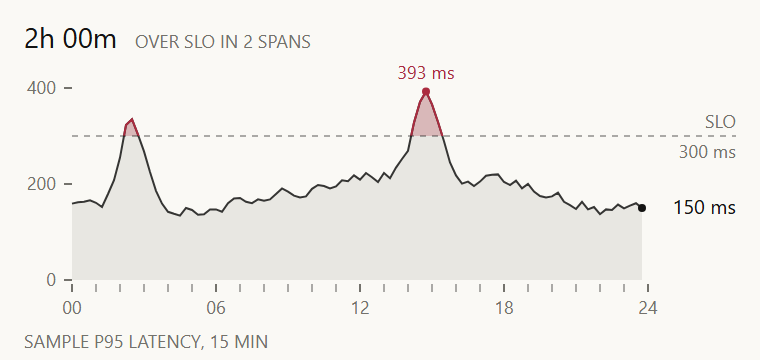 Latency with SLOLatency as a faint area under a thin line, with a dashed SLO and every span above it tinted red and counted in the header.
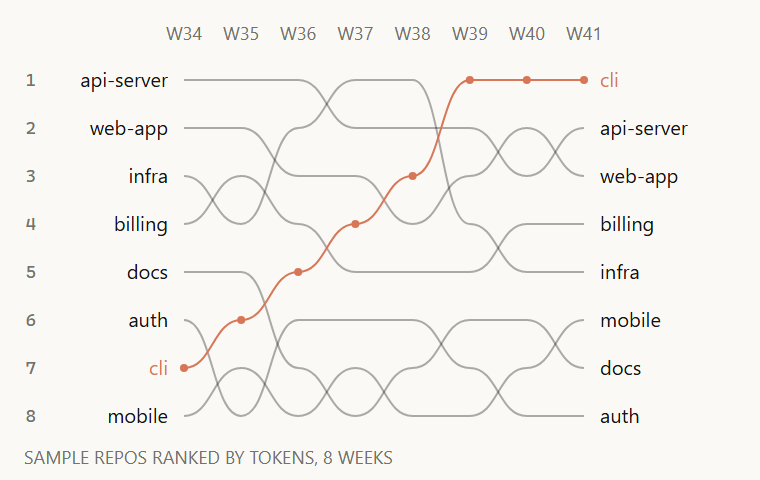 Bump chartRepos ranked by tokens week by week; each line shows a repo overtaking and falling back, names at both ends, one climber in Claude orange.
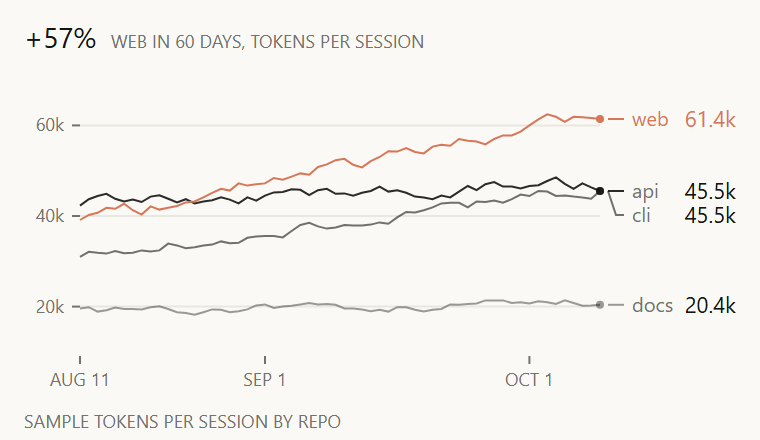 Multi-line chartSeveral series as thin lines, the one to notice in Claude orange, with end labels pushed apart so close finishes stay readable.
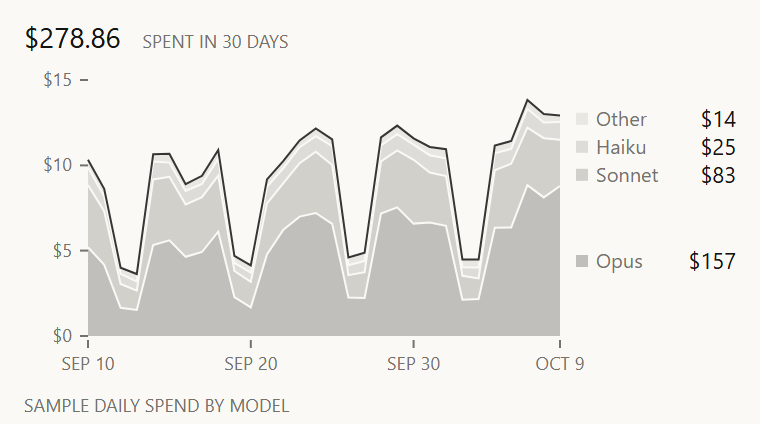 Stacked area chartDaily spend stacked by model in quiet ink steps, each band named at its right end with its total for the period.
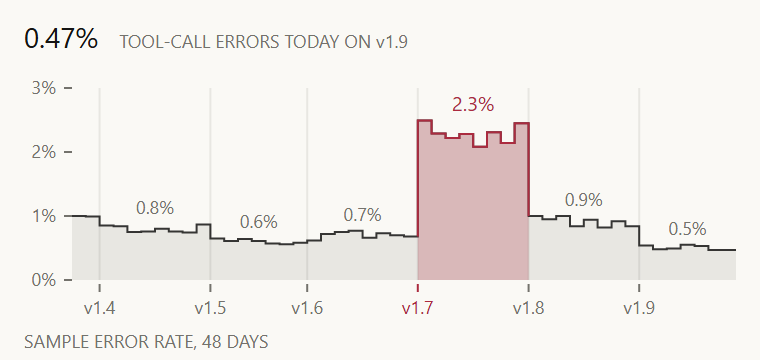 Step line by releaseDaily error rate as a step line with each release marked under the plot and labelled with its mean; the worst release is red.
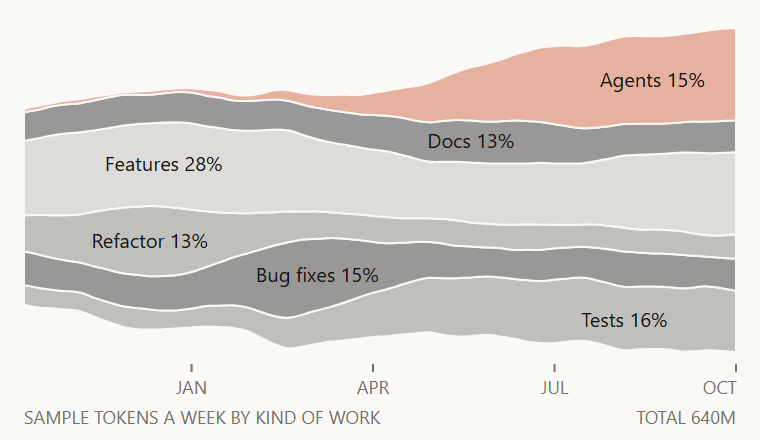 StreamgraphTokens a week by kind of work over a year as flowing streams around a moving centre line, each named inside its widest part.
Usage and limits
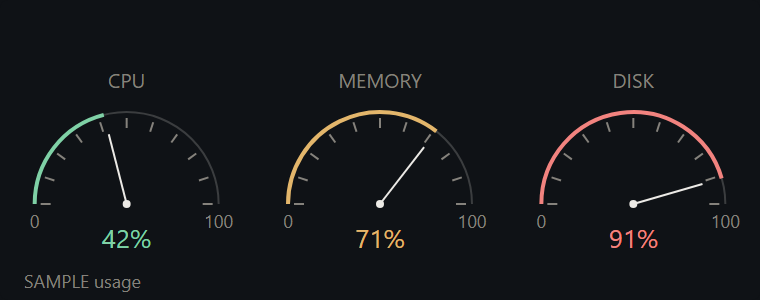 GaugesThree semicircular dials with ticks every 10%, coloured by threshold so the state reads before the number.
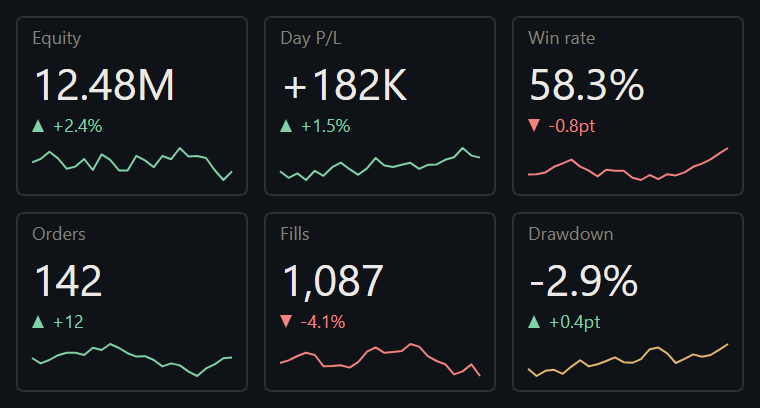 Stat tilesSix stat tiles with a muted label, a large value, a delta with a drawn triangle and a sparkline along the bottom.
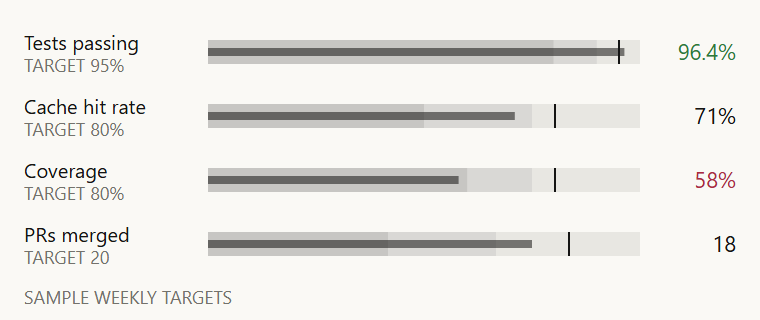 Bullet graphsFour bullet graphs: poor, fair and good ranges in ink steps, a thin value bar and a target tick; the value turns green once the target is met.
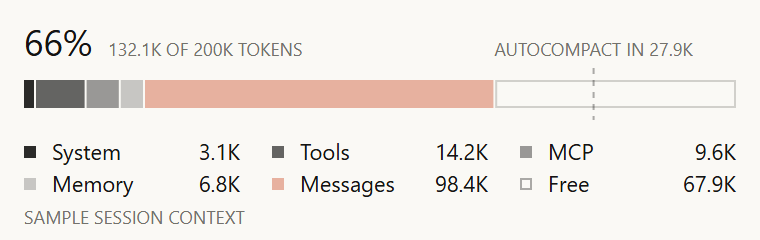 Context window meterOne stacked bar of the context window split into system, tools, MCP, memory and messages, with free space hollow and the autocompact line.
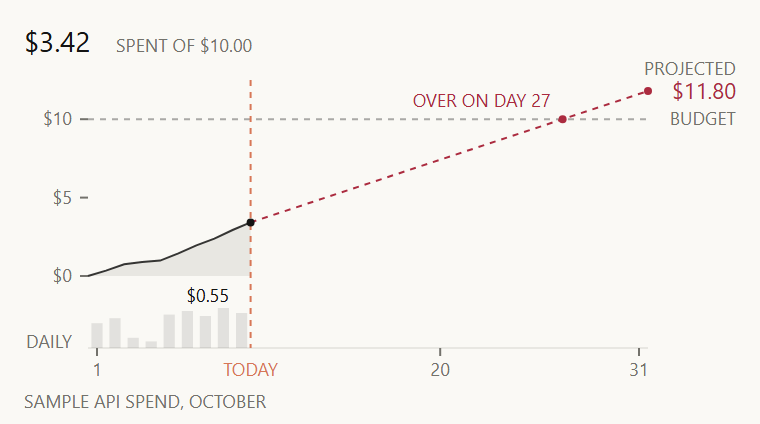 Spend against budgetRunning spend for the month against a flat budget, with a least-squares projection to month end that turns red when it would go over.
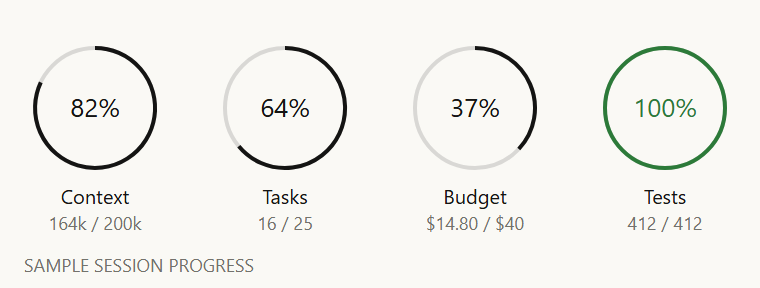 Progress ringsFour full rings in a row, each a 2px arc over a faint track with the percent in the centre; a ring that is full turns green.
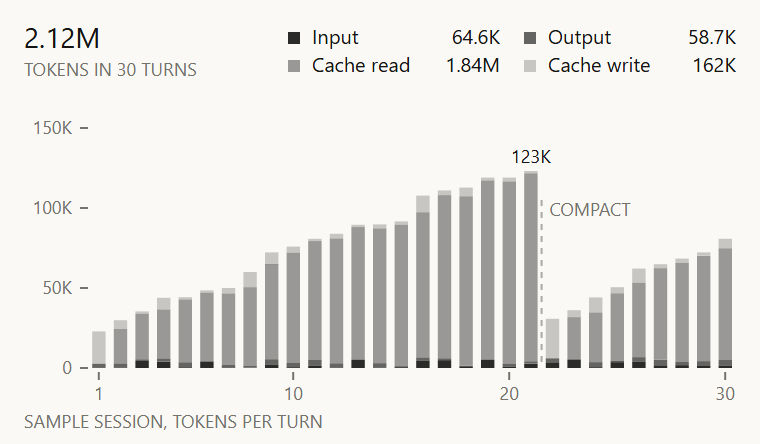 Tokens per turnStacked columns of input, output, cache read and cache write tokens for each turn of a session, with totals in the legend and the largest turn labelled.
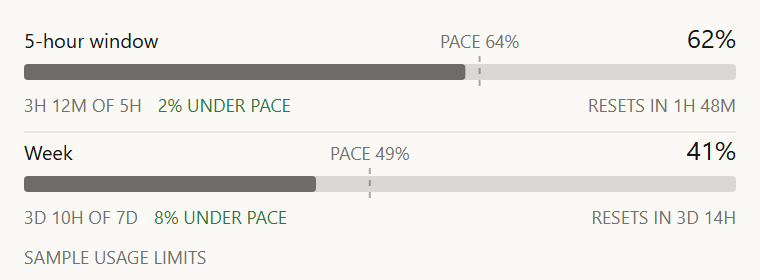 Usage limit bandsTwo usage limit tracks, the rolling session window and the week, each with an even-pace tick at the time elapsed; use ahead of pace turns Claude orange.
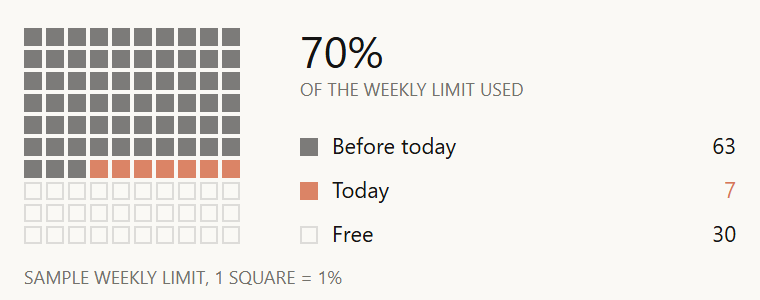 Waffle chartA 10 by 10 waffle of the weekly limit, one square per percent: used earlier, today in Claude orange, and free squares kept as outlines.
Code and CI
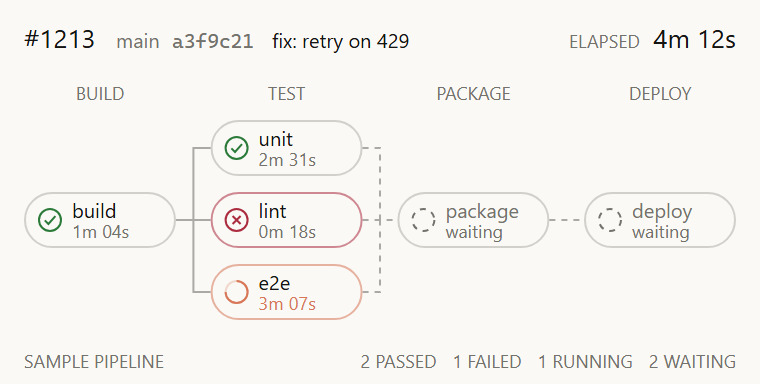 CI pipelineA CI run as stages from left to right: job pills with line-art status glyphs and durations, elbow links, and dashed links into stages still waiting.
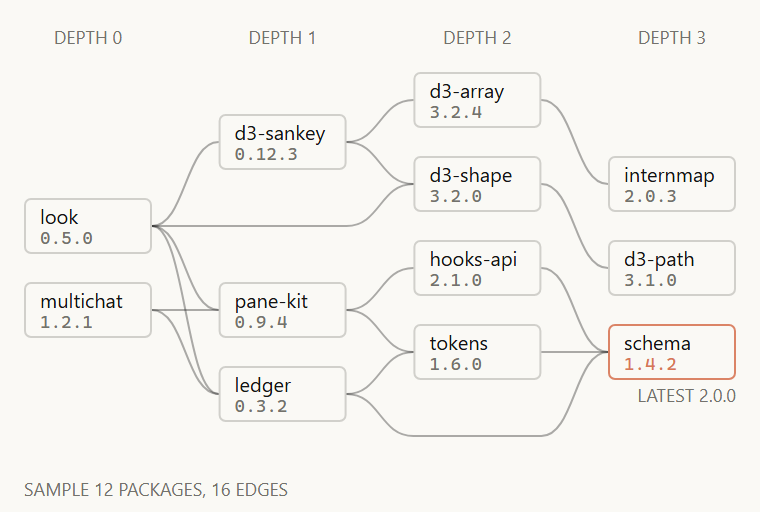 Dependency graphPackages of a workspace as a layered graph from left to right: longest-path columns, barycentre order, versions, one outdated package.
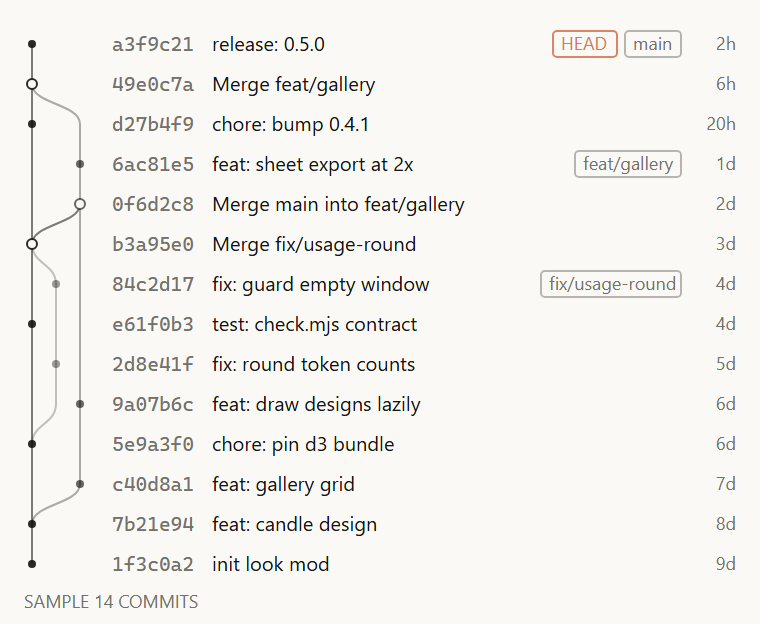 Git graphCommit history on main, fix and feature lanes with curved branch and merge links, short shas, branch tags and HEAD on the tip.
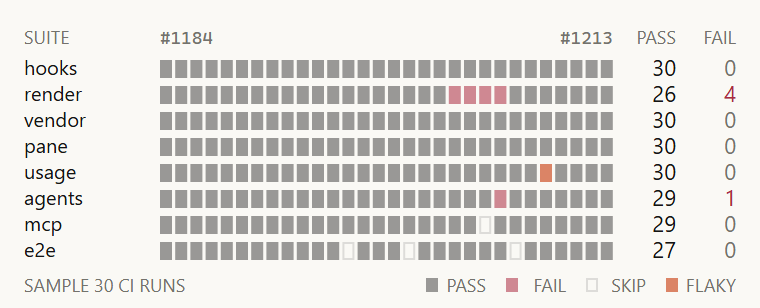 Test results gridTest suites across recent CI runs: pass, fail and skipped cells, a flaky run in Claude orange, and pass and fail counts for each suite.
Work and agents
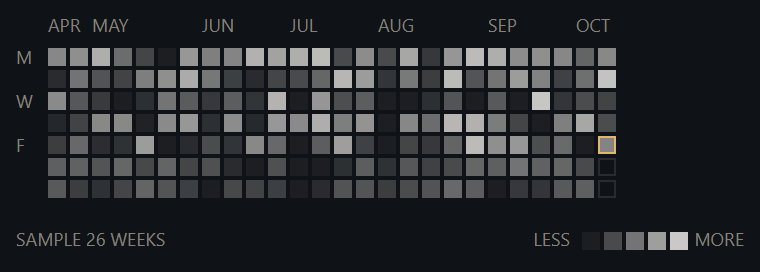 Calendar heatmapCalendar heatmap of 26 weeks by 7 days; idle days keep their place, today is the one Claude orange cell.
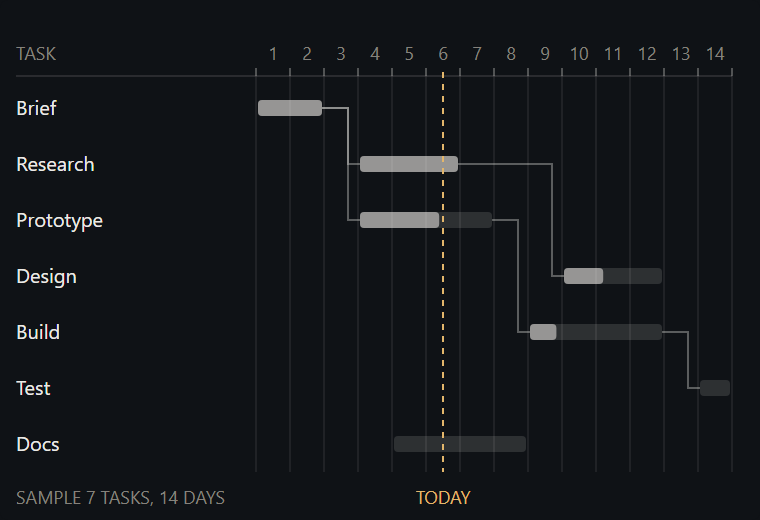 Gantt chartSeven tasks over 14 days with done parts, finish-to-start links that never cross a bar, and a today line.
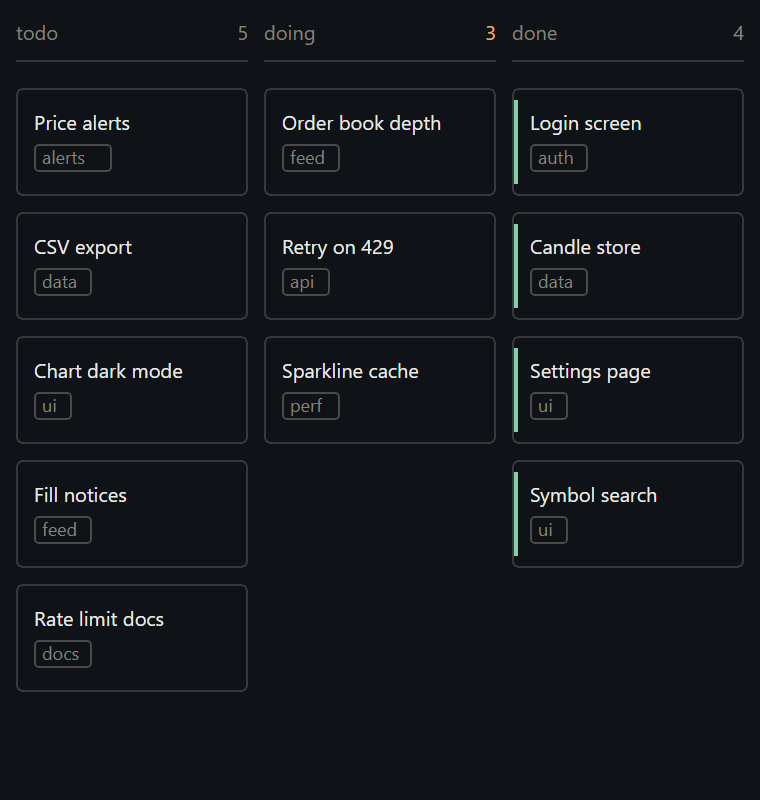 Kanban boardThree-column board of outlined cards, with a thin green stripe on the done ones; columns carry the structure.
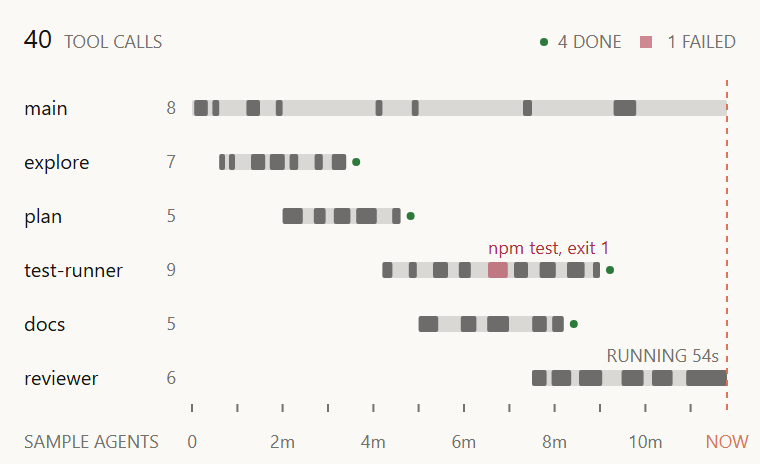 Subagent swimlanesThe main agent and its subagents as lanes over time: tool calls are segments on each lane, a failed call is red and a running call stays open to the NOW line.
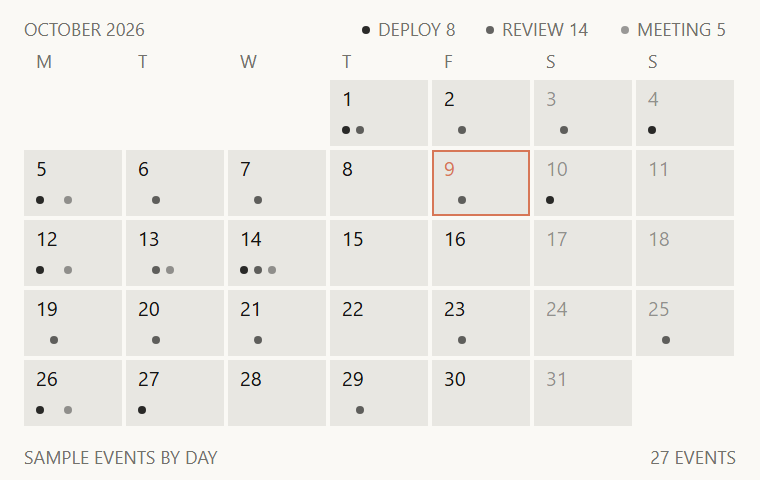 Month calendarA month grid from Monday with one dot per event kind in its own slot, a counted legend, and today outlined in Claude orange.
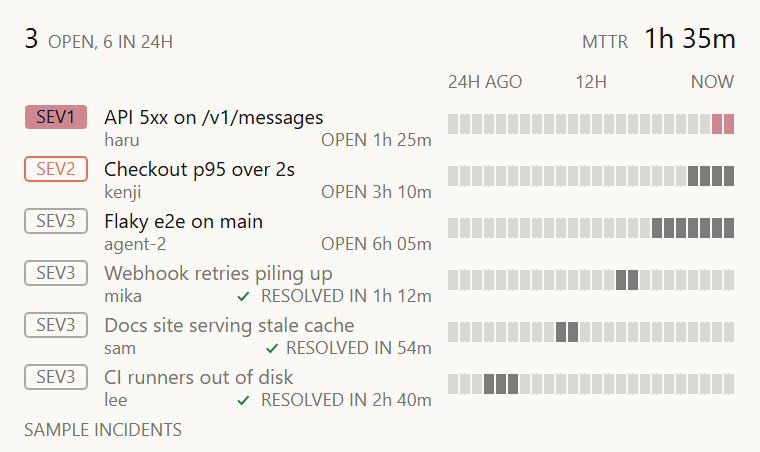 Incident boardIncidents by severity with owner, age and a 24-hour status strip per row; the mean time to resolve sits top right, worked out from the resolved rows.
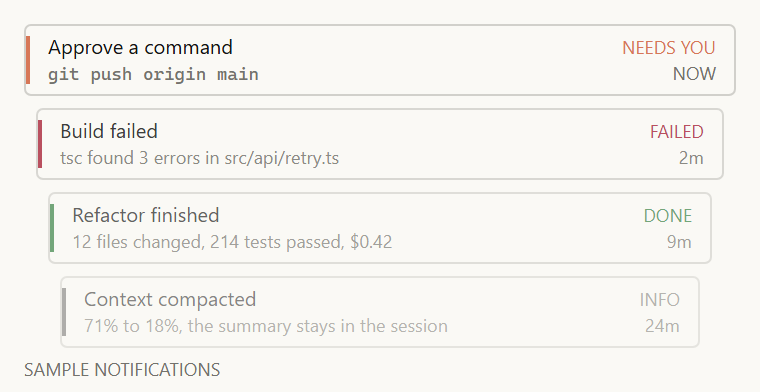 Notification stackThe latest notifications as a receding stack of cards, newest on top; a left stripe and a label name the kind, and older cards inset and fade.
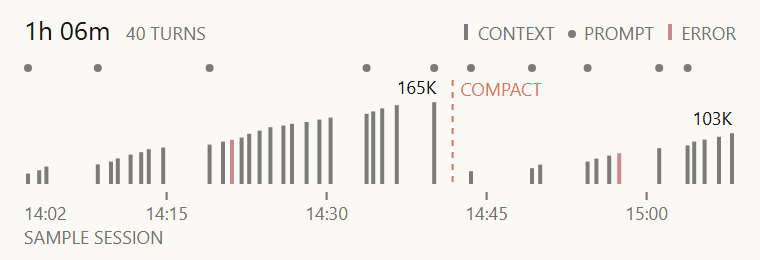 Session timelineTurns of one session on a clock track: tick height is the context sent, dots mark prompts, red ticks are failed calls and the compaction is marked in Claude orange.
Compare
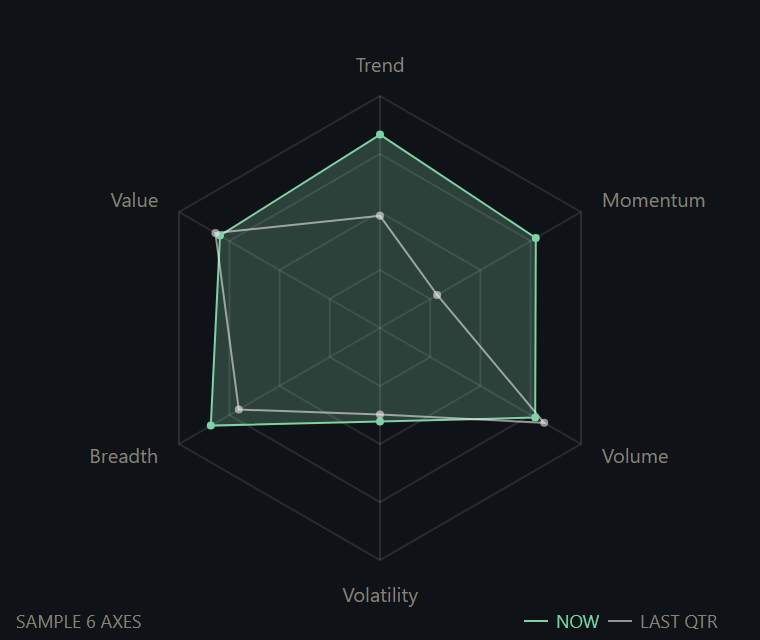 Radar chartSix axes with two series, the newer one filled, with a dot on each vertex so single values can be read.
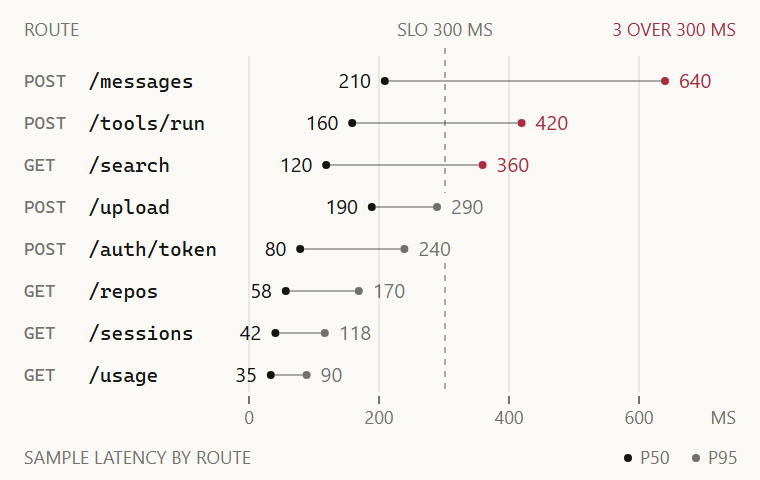 Dumbbell chartp50 and p95 latency per API route on one scale: a thin link between two dots, values at both ends, the p95 dot red past the latency objective.
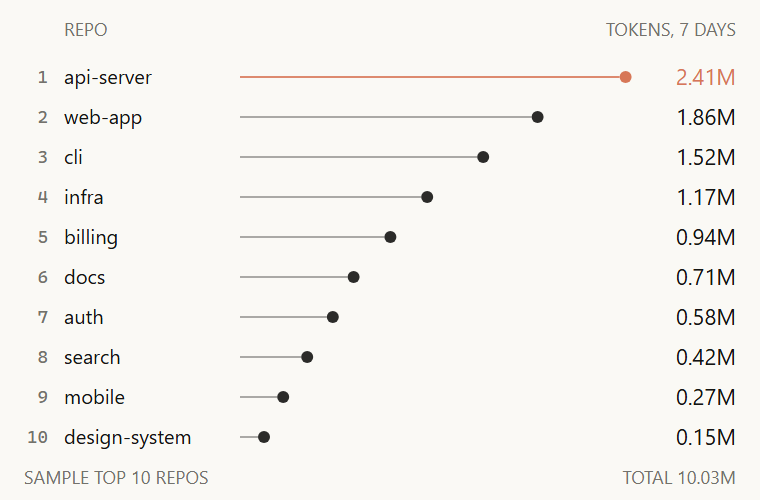 Lollipop chartThe top ten repos by tokens, sorted: a thin stem and a dot for each, values on the right, and the top repo in Claude orange.
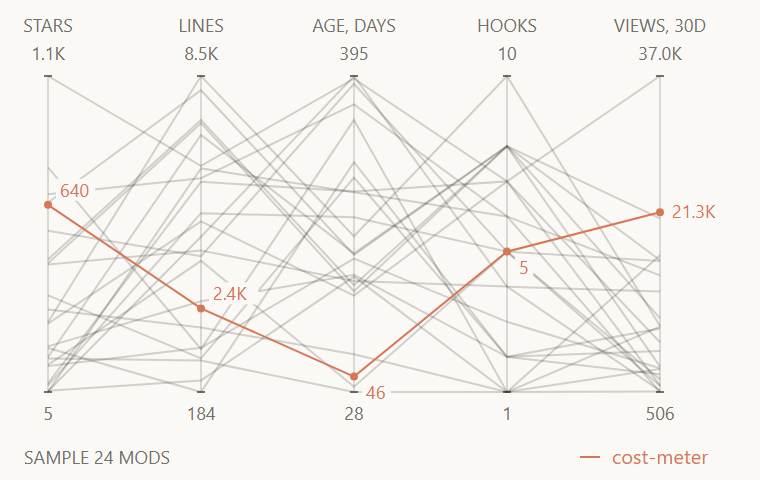 Parallel coordinatesMods compared across stars, lines, age, hooks and views; each axis runs min to max, one mod in Claude orange with its values.
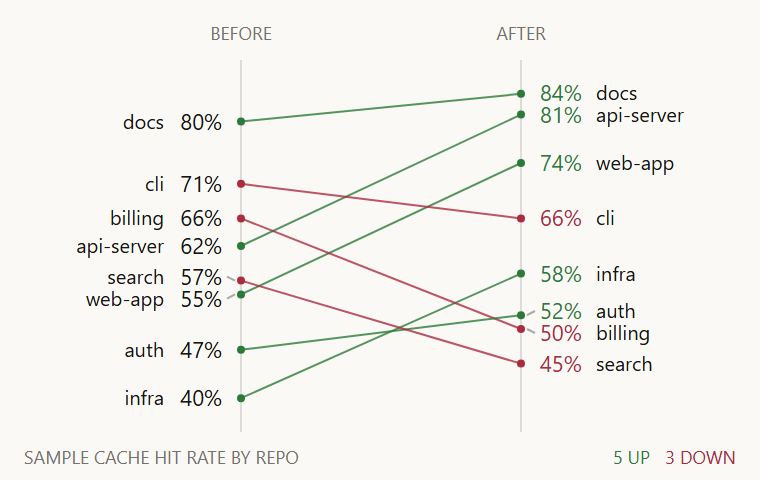 Slope chartBefore and after for each item on two columns: green lines rose, red lines fell, and close labels on each side are pushed apart.
Spread
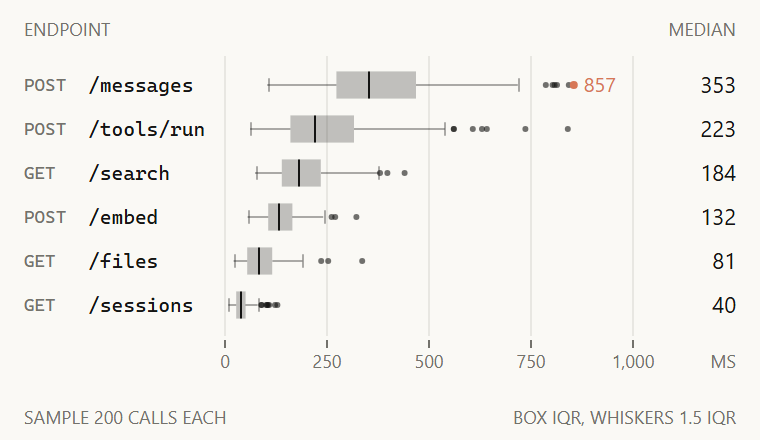 Box plotsResponse time for six API endpoints on one scale: quartile boxes, a median line, Tukey whiskers and outlier dots, the slowest call in Claude orange.
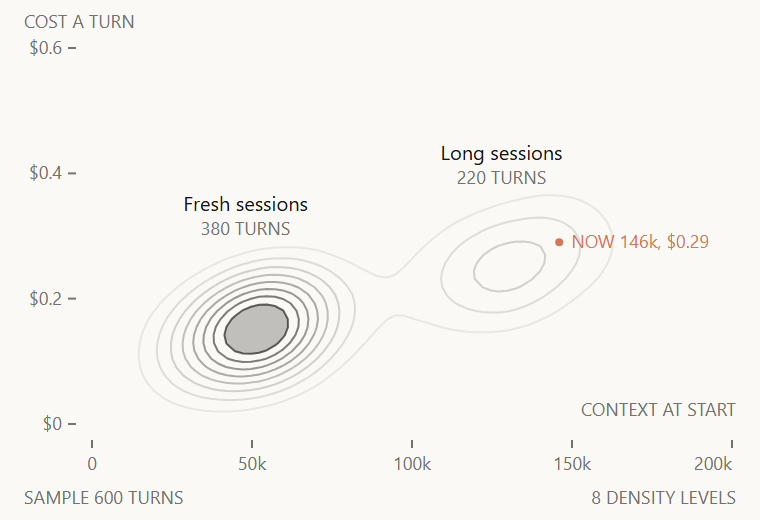 Density contoursTurns by context size and cost as eight density lines that brighten toward the core, the densest level filled and the current turn in Claude orange.
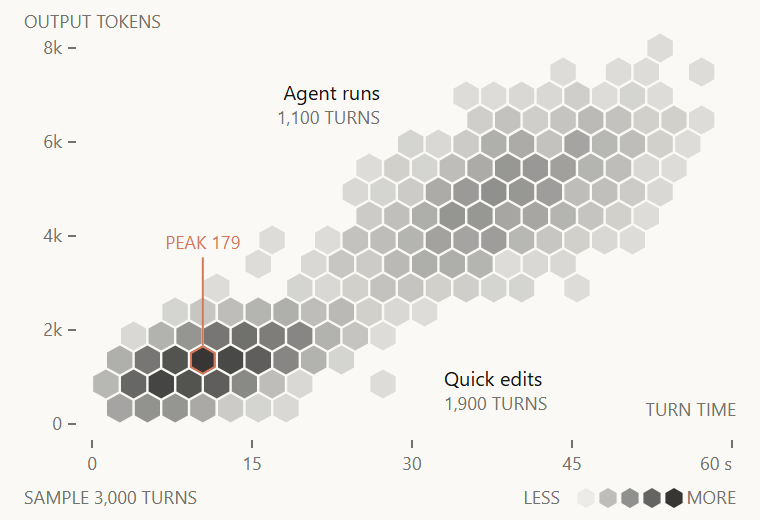 Hexbin plotThousands of turns binned into hexagons by time and output tokens, brighter where turns pile up, with the busiest cell in Claude orange.
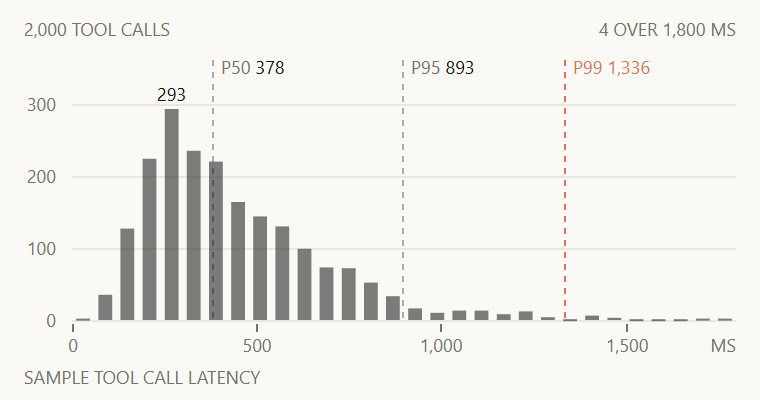 HistogramTool call latency in 30 bins with a long right tail; dashed p50, p95 and p99 lines carry their values, p99 in Claude orange.
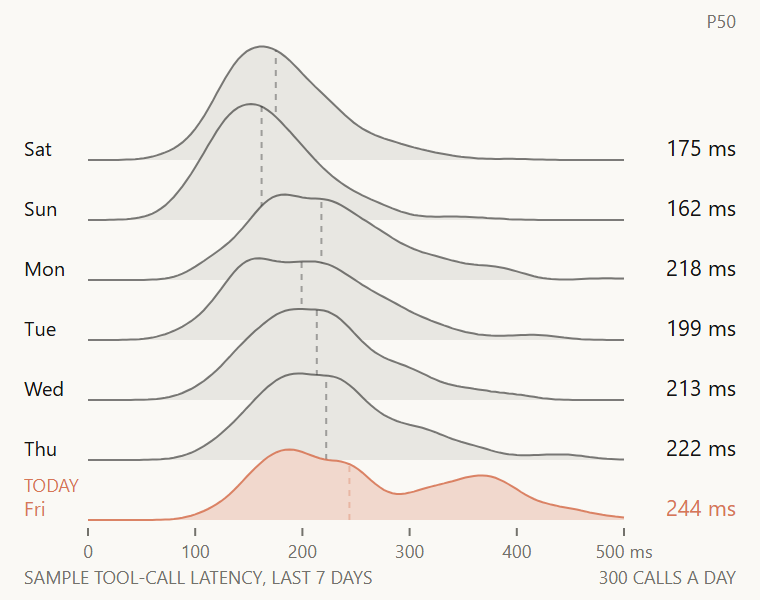 Ridgeline plotLatency density for each of the last seven days as overlapping rows on one scale, the median marked on each row and today in front in Claude orange.
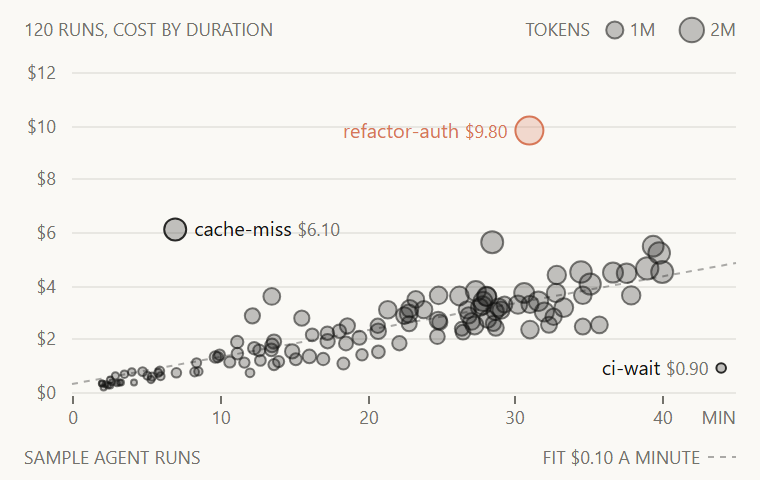 Scatter plotAgent runs by duration and cost, bubble area for tokens, with a dashed least-squares fit and the three runs furthest from it named.
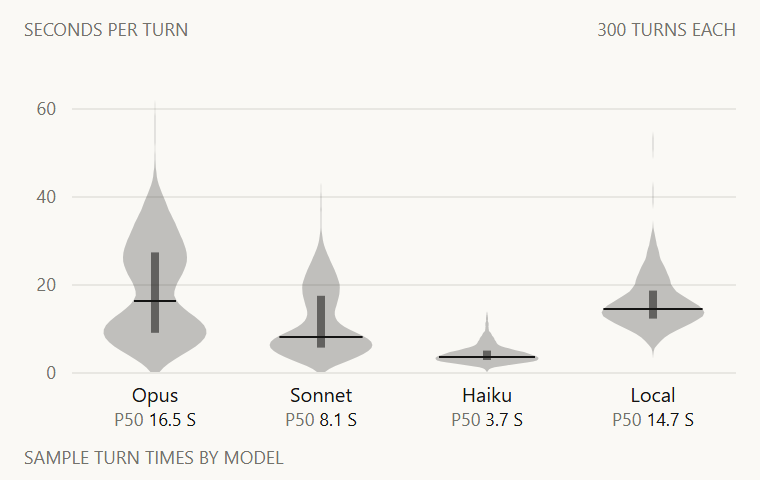 Violin plotSeconds per turn for four models as mirrored density shapes, with an interquartile bar and a median line; two of the shapes have two bulges.
Parts of a whole
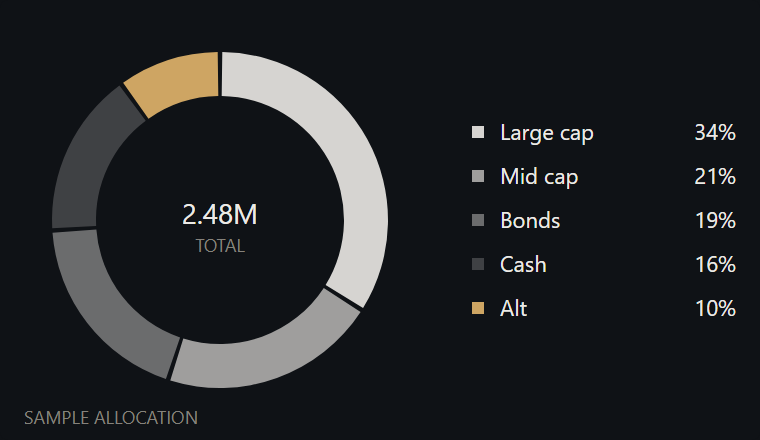 Donut chartAllocation ring of five segments with even 2px gaps, the total in the centre and a legend with each share.
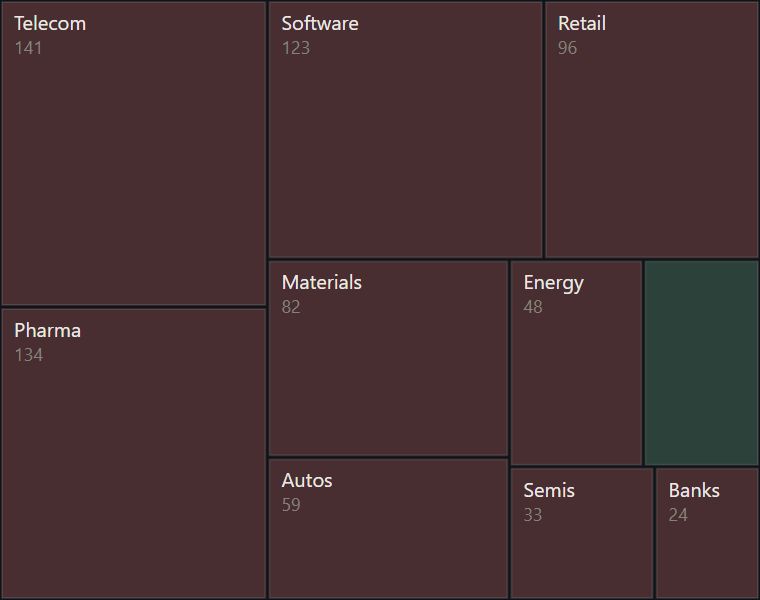 TreemapTen sectors laid out by the squarified method across the whole pane, sized by value and tinted by the sign of change.
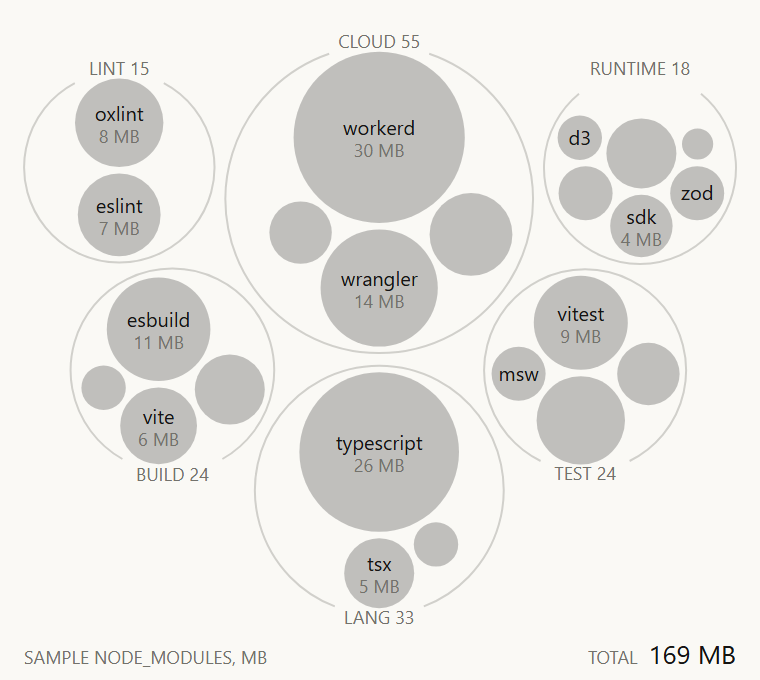 Circle packingInstalled packages packed inside their groups, each circle sized by disk space, with names inside where they fit and group totals on the outlines.
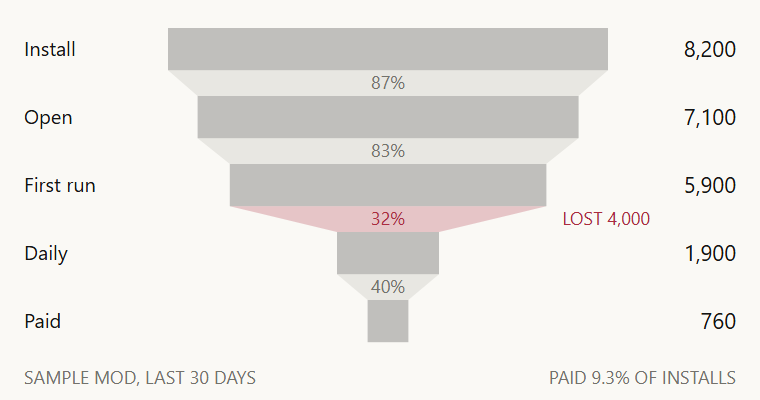 Funnel chartFive centred bars from install to paid with the conversion of each step between them; the step that loses the most people is drawn in red.
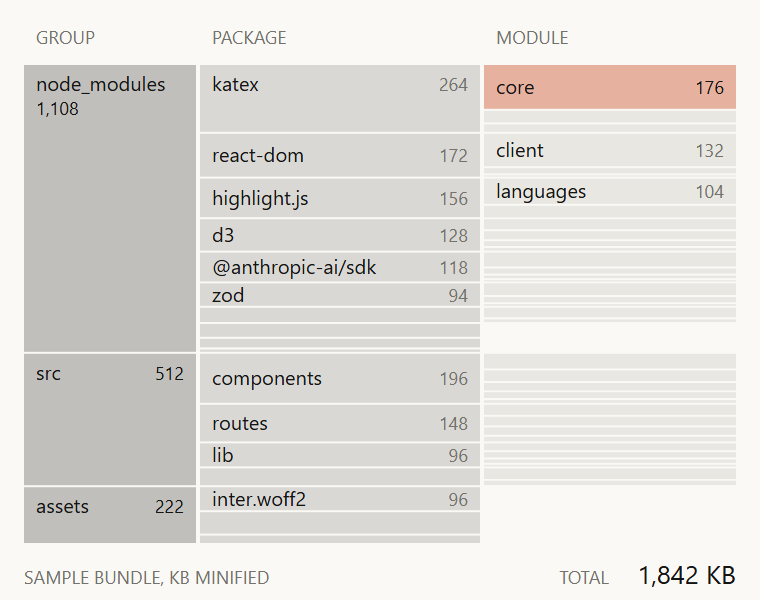 Icicle chartA web bundle split into group, package and module from left to right, sized by bytes, names where they fit and the largest module marked.
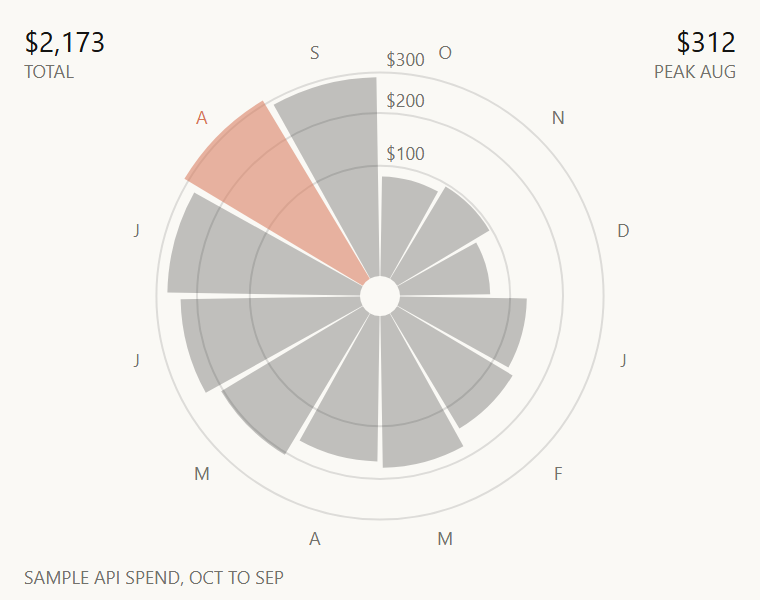 Polar area chartMonthly spend as equal-angle wedges whose area carries the value, with square-root rings, the total and the one peak month marked.
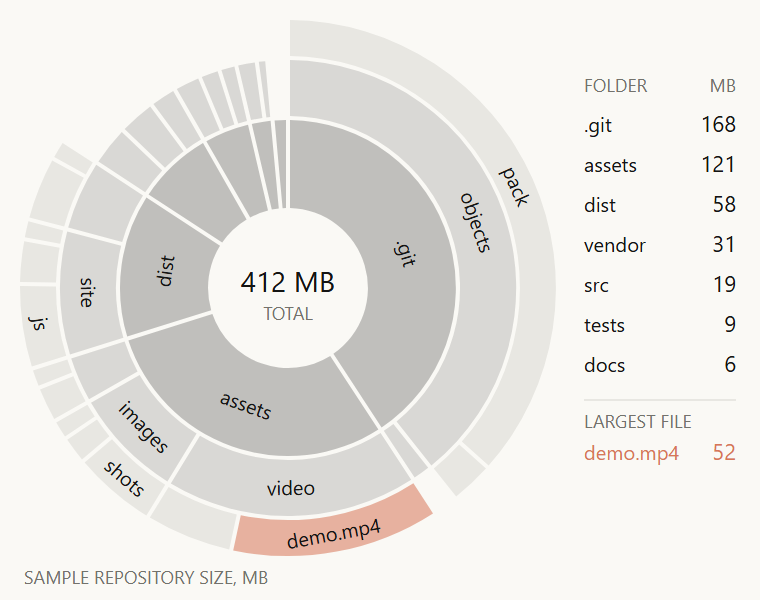 Sunburst chartRepository size three folders deep as rings with even 2px gaps, names only where they fit, the total in the centre and one large file marked.
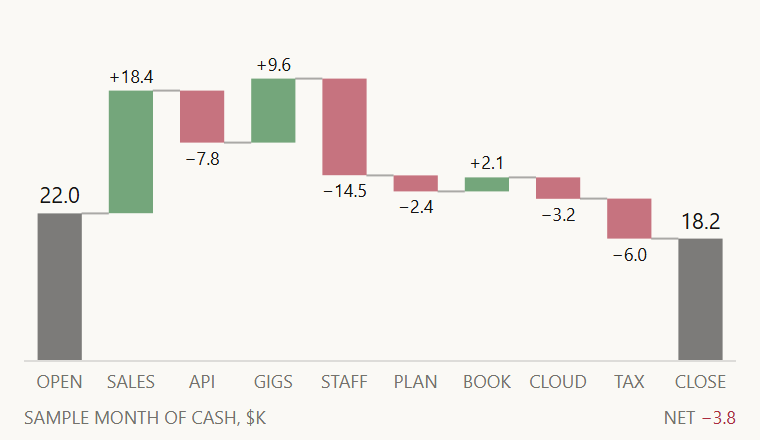 Waterfall chartA month of cash from opening to closing balance: each rise and fall floats from the last level, joined by thin connectors.
Flows and links
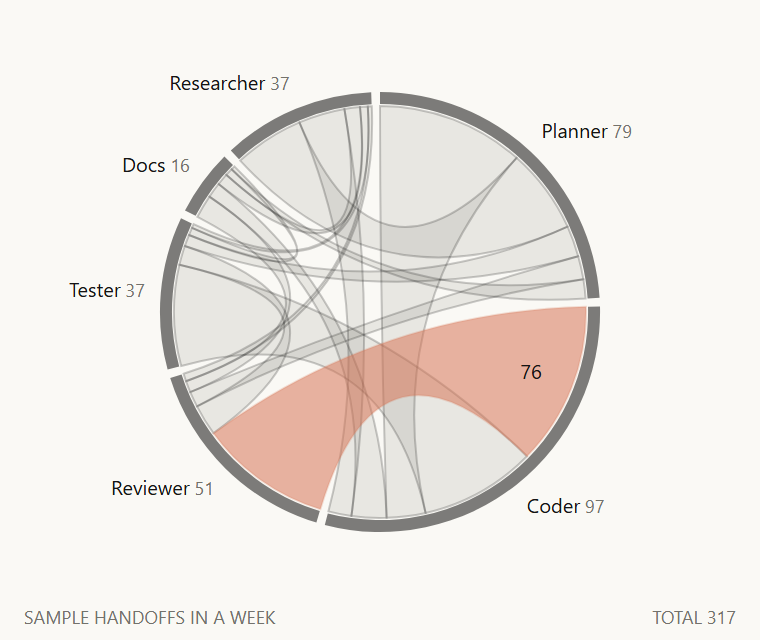 Chord diagramHandoffs between agents around a ring: ribbon width by handoffs each way, with the busiest pair in Claude orange and its count.
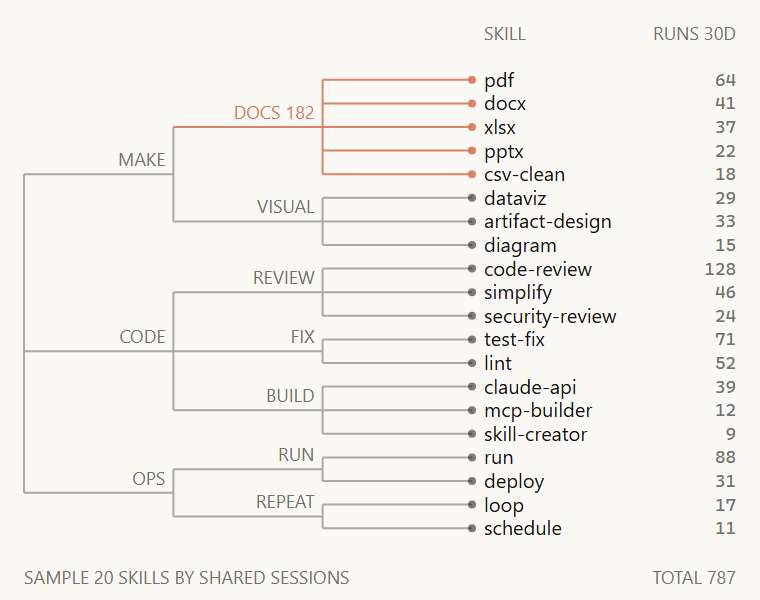 DendrogramAgent skills clustered by shared sessions as a tree from root to leaves, with runs per skill and one cluster in Claude orange.
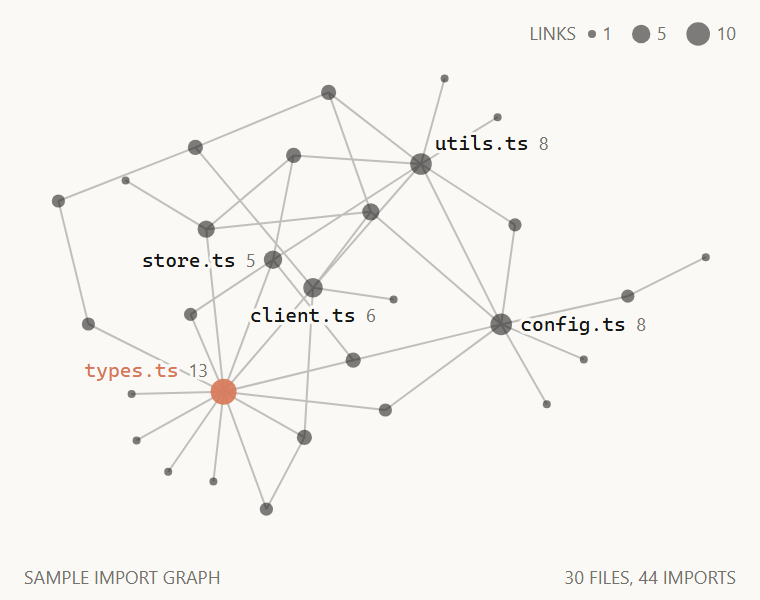 Force-directed graphImport graph of a small repo laid out by forces: dot size by number of links, the hub file in Claude orange, the busiest files named.
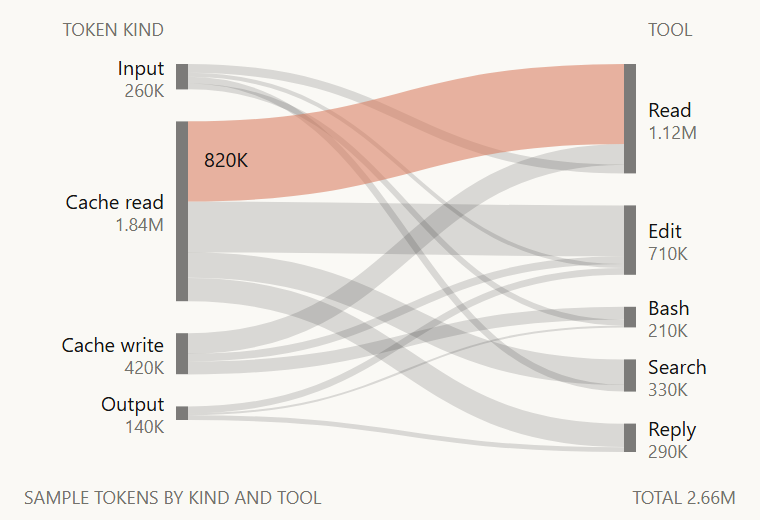 Sankey diagramWhere tokens go: each kind of token flows into the tools that spent it, link width by volume, with the largest flow in Claude orange.
Code: PolyForm Noncommercial License 1.0.0. Required Notice: Copyright 2026 Haruki Nakada (https://modscode.com). Some designs import open-source libraries (d3, ISC); each design's page names them.